
A VM is attached to this room. You don’t need SSH or RDP; the room provides a “Split View” feature. Exercise files are located in the folder on the desktop. Log cleaner script “clear-logs.sh” is available in each exercise folder.
Introduction to Network Monitoring Approaches
Network monitoring is a set of management actions to watch/continuously overview and optionally save the network traffic for further investigation. This action aims to detect and reduce network problems, improve performance, and in some cases, increase overall productivity. It is a main part of the daily IT/SOC operations and differs from Network Security Monitoring (NSM) in its purpose.
Network Monitoring
- Network monitoring is highly focused on IT assets like uptime (
availability), device health and connection quality (performance), and network traffic balance and management (configuration). - Monitoring and visualising the network traffic, troubleshooting, and root cause analysis are also part of the Network Monitoring process.
- This model is helpful for network administrators and usually doesn’t cover identifying non-asset in-depth vulnerabilities and significant security concerns like internal threats and zero-day vulnerabilities.
- Usually, Network Monitoring is not within the SOC scope. It is linked to the enterprise IT/Network management team.
Network Security Monitoring
Network Security Monitoring is focused on network anomalies like rogue hosts, encrypted traffic, suspicious service and port usage, and malicious/suspicious traffic patterns in an intrusion/anomaly detection and response approach. Monitoring and visualising the network traffic and investigating suspicious events is a core part of Network Security Monitoring. This model is helpful for security analysts/incident responders, security engineers and threat hunters and covers identifying threats, vulnerabilities and security issues with a set of rules, signatures and patterns. Network Security Monitoring is part of the SOC, and the actions are separated between tier 1-2-3 analyst levels.
What is ZEEK?
Zeek (formerly Bro) is an open-source and commercial passive Network Monitoring tool (traffic analysis framework) developed by Lawrence Berkeley Labs. Today, Zeek is supported by several developers, and Corelight provides an Enterprise-ready fork of Zeek. Therefore this tool is called both open source and commercial. The differences between the open-source version and the commercial version are detailed here.
Zeek differs from known monitoring and IDS/IPS tools by providing a wide range of detailed logs ready to investigate both for forensics and data analysis actions. Currently, Zeek provides 50+ logs in 7 categories.
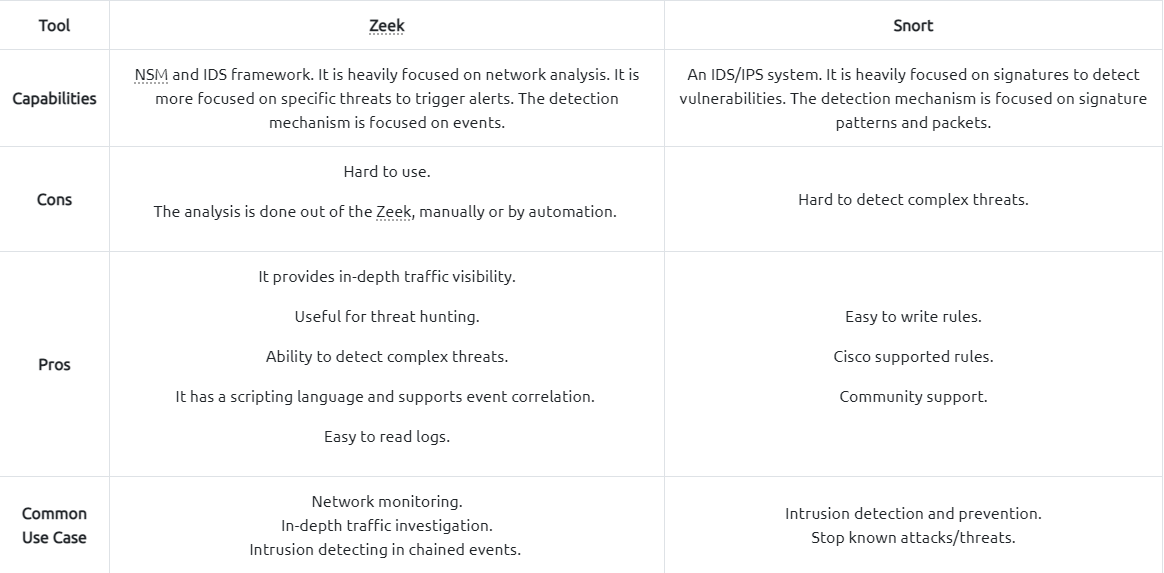
Zeek vs Snort
While both are called IDS/NIDS, it is good to know the cons and pros of each tool and use them in a specific manner. While there are some overlapping functionalities, they have different purposes for usage.
Zeek Architecture
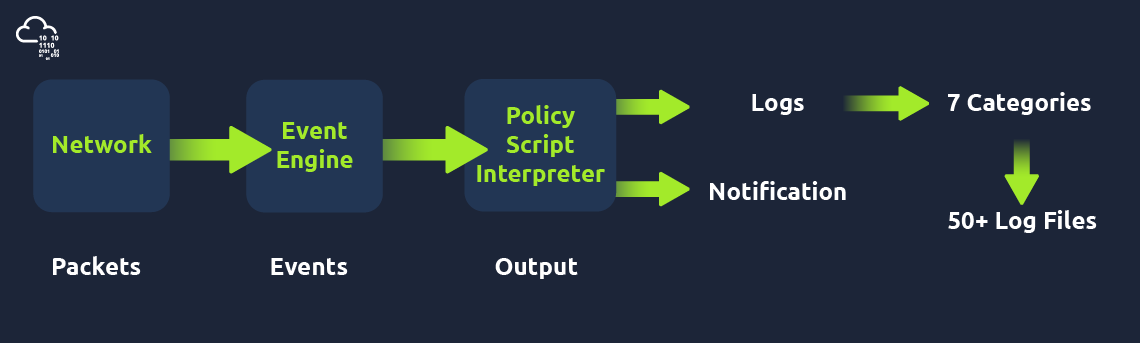
- Zeek has two primary layers; “
Event Engine” and “Policy Script Interpreter”. The Event Engine layer is where the packets are processed; it is called theevent coreand is responsible for describing the event without focusing on event details. It is where the packages are divided into parts such as:
1
2
3
  - Source and Destination addresses,
  - Protocol Identification,
  - Session analysis and File extraction
- The Policy Script Interpreter layer is where the semantic analysis is conducted. It is responsible for describing the event correlations by using Zeek scripts:
Zeek Frameworks
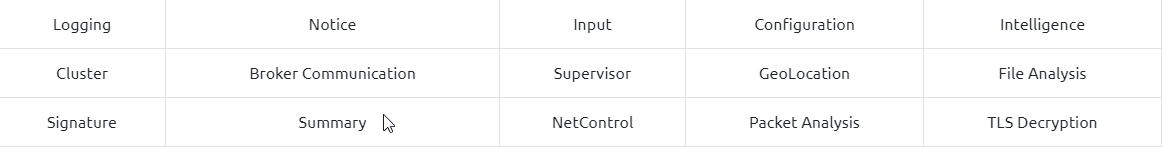
- Zeek has several frameworks to provide extended functionality in the scripting layer.
- These frameworks enhance Zeek’s flexibility and compatibility with other network components.
- Each framework focuses on the specific use case and easily runs with Zeek installation.
- For instance, we will be using the “
Logging Framework” for all cases. - Having ide on each framework’s functionality can help users quickly identify an event of interest.
Available Frameworks:
1
- You can read more on frameworks [**here**](https://docs.zeek.org/en/master/frameworks/index.html).
Zeek Outputs
As mentioned before, Zeek provides 50+ log files under seven different categories, which are helpful in various areas such as traffic monitoring, intrusion detection, threat hunting and web analytics. This section is not intended to discuss the logs in-depth. The logs are covered in TASK 3.
Once you run Zeek, it will automatically start investigating the traffic or the given pcap file and generate logs automatically. Once you process a pcap with Zeek, it will create the logs in the working directory. If you run the Zeek as a service, your logs will be located in the default log path.
The default log path is:
1
/opt/zeek/logs/
Working with Zeek
- There are two operation options for Zeek. The first one is running it as a service, and the second option is running the Zeek against a pcap.
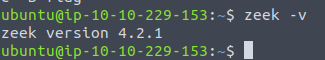
- Before starting working with Zeek, let’s check the version of the Zeek instance with the following command:
1
$ zeek -v
- Now we are sure that we have Zeek installed.
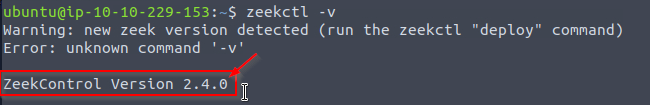
- Let’s start the Zeek as a service(daemon)! To do this, we need to use the “
ZeekControl” module, as shown below. - The “
ZeekControl” module requires superuser permissions to use. You can elevate the session privileges and switch to the superuser account to examine the generated log files with the following command:1
$ sudo su
- Here we can manage the Zeek service and view the status of the service.
Primary management of the Zeek service is done with three commands:
1
2
3
  - "status"
  - "start" and
  - "stop"
Zeek Control Module:
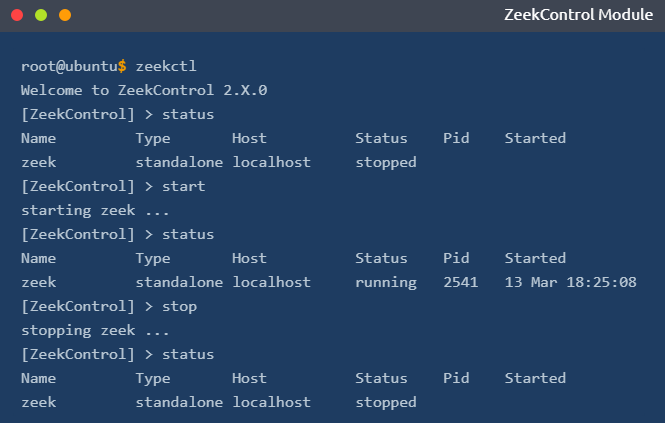
You can also use the “ZeekControl” mode with the following commands as well:
zeekctl statuszeekctl startzeekctl stop- The only way to listen to the live network traffic is using
Zeek as a service. - Apart from using the Zeek as a network monitoring tool, we can also use it as a packet investigator.
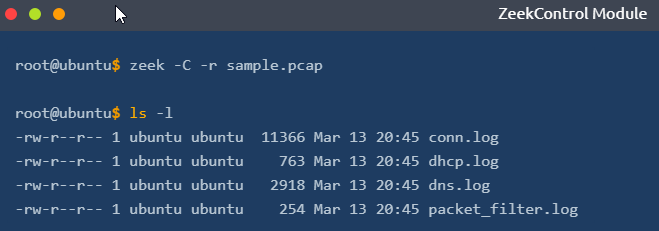
- To do so, we need to process the pcap files with Zeek, as shown below.
- Once you process a pcap file, Zeek automatically creates log files according to the traffic.
In pcap processing mode, logs are saved in the working directory.
You can view the generated logs using the ls -l command:
1
$ zeek -C -r sample.pcap
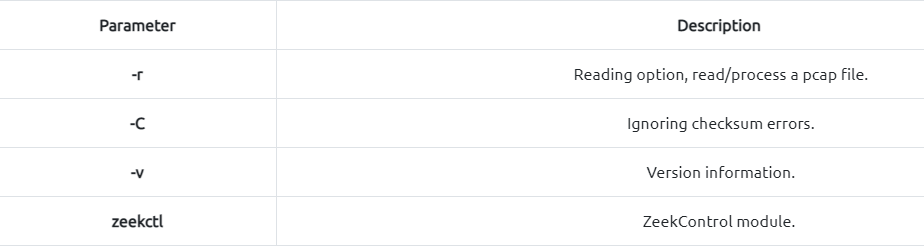
Breakdown of the Zeek command above:
1
2
3
4
- '-r' : Reading option, read/process a pcap file
- '-C' : Ignoring checksum errors
- '-v' : Version information
- 'zeekctl' : ZeekControl module
Investigating the generated logs will require command-line tools (cat, cut, grep sort, and uniq) and additional tools (zeek-cut). We will cover them in the following tasks.
Questions and Answers section
- What is the installed Zeek instance version number?
4.2.1
- What is the version of the ZeekControl module?
- Investigate the “
sample.pcap“ file. What is the number of generated alert files?
1
$ zeek -C -r sample.pcap
Output:
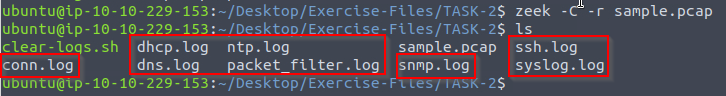
-> Logs generated: 8
1
2
3
4
5
6
7
8
- conn.log
- dhcp.log
- dns.log
- ntp.log
- packet_filter.log
- snmp.log
- ssh.log
- syslog.log
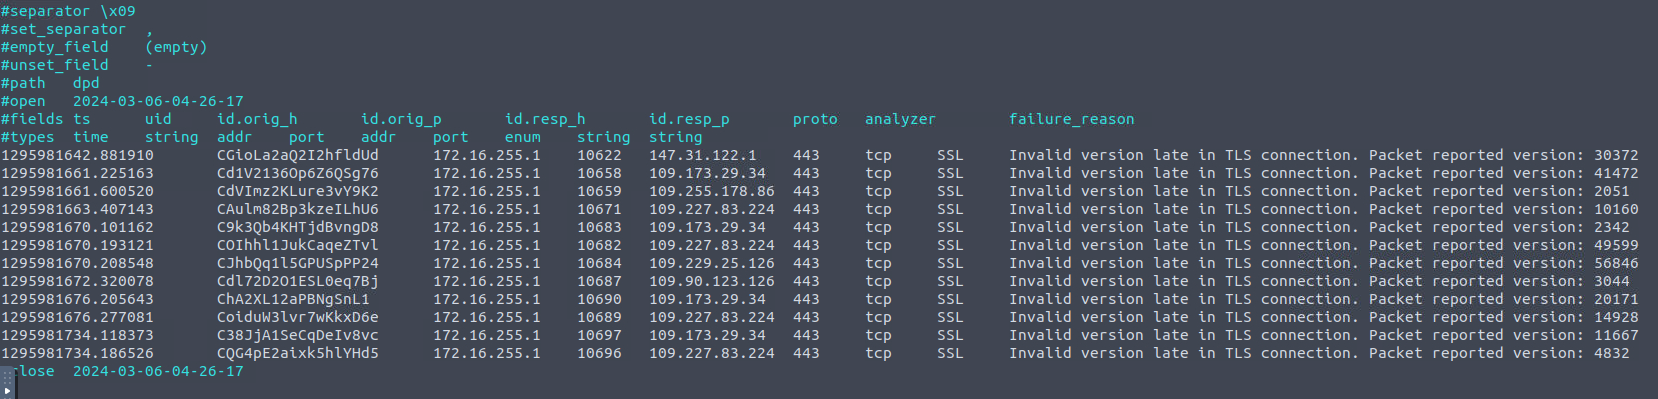
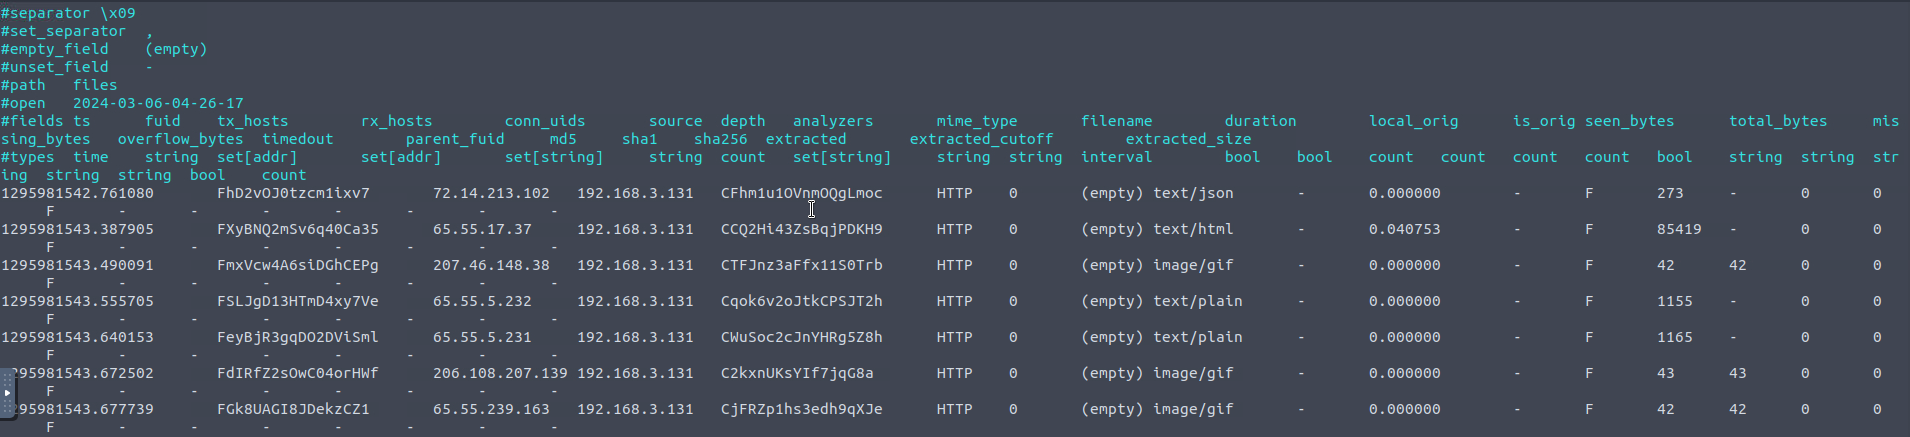
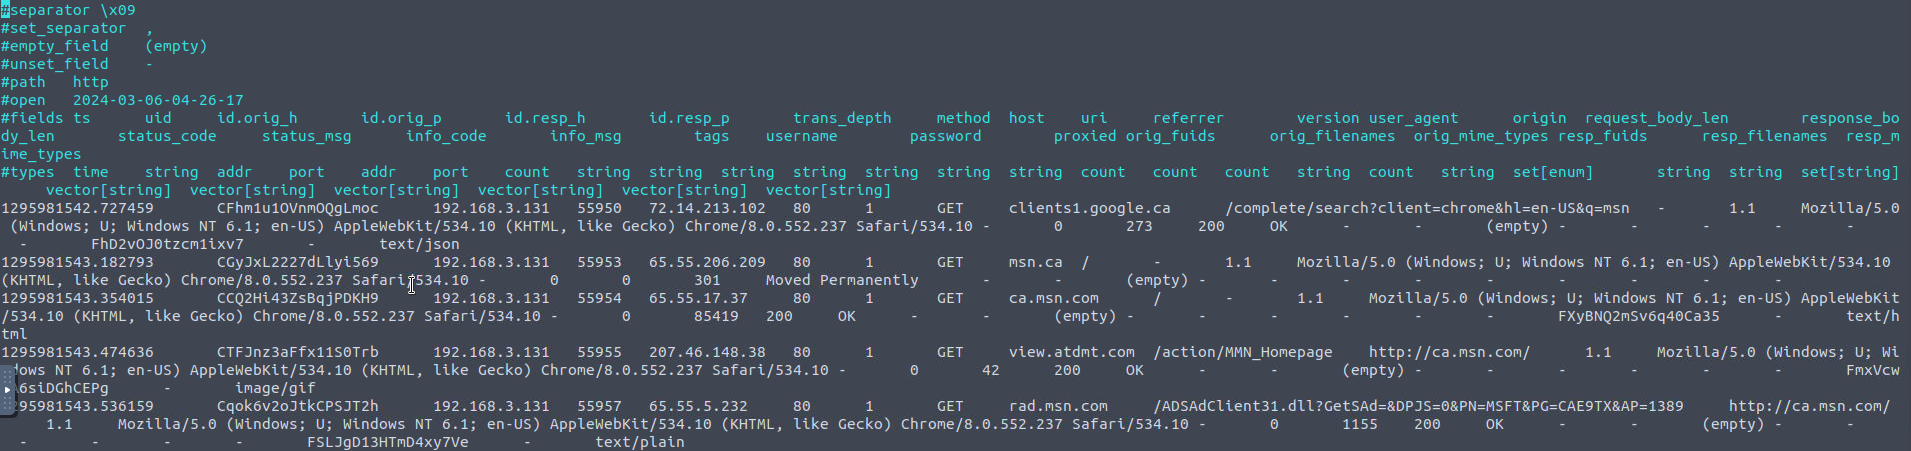
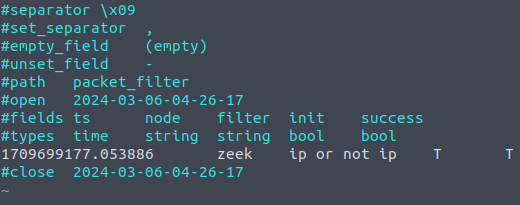
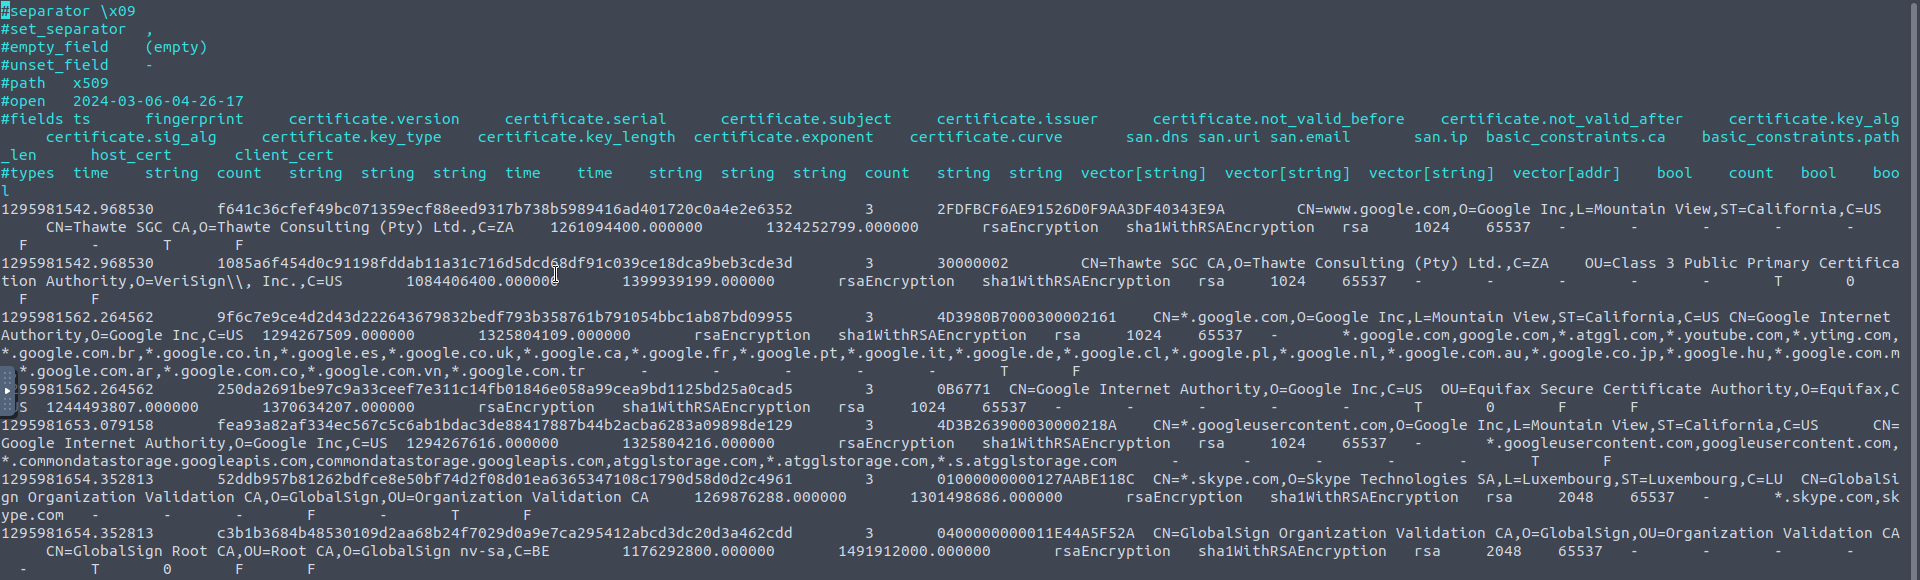
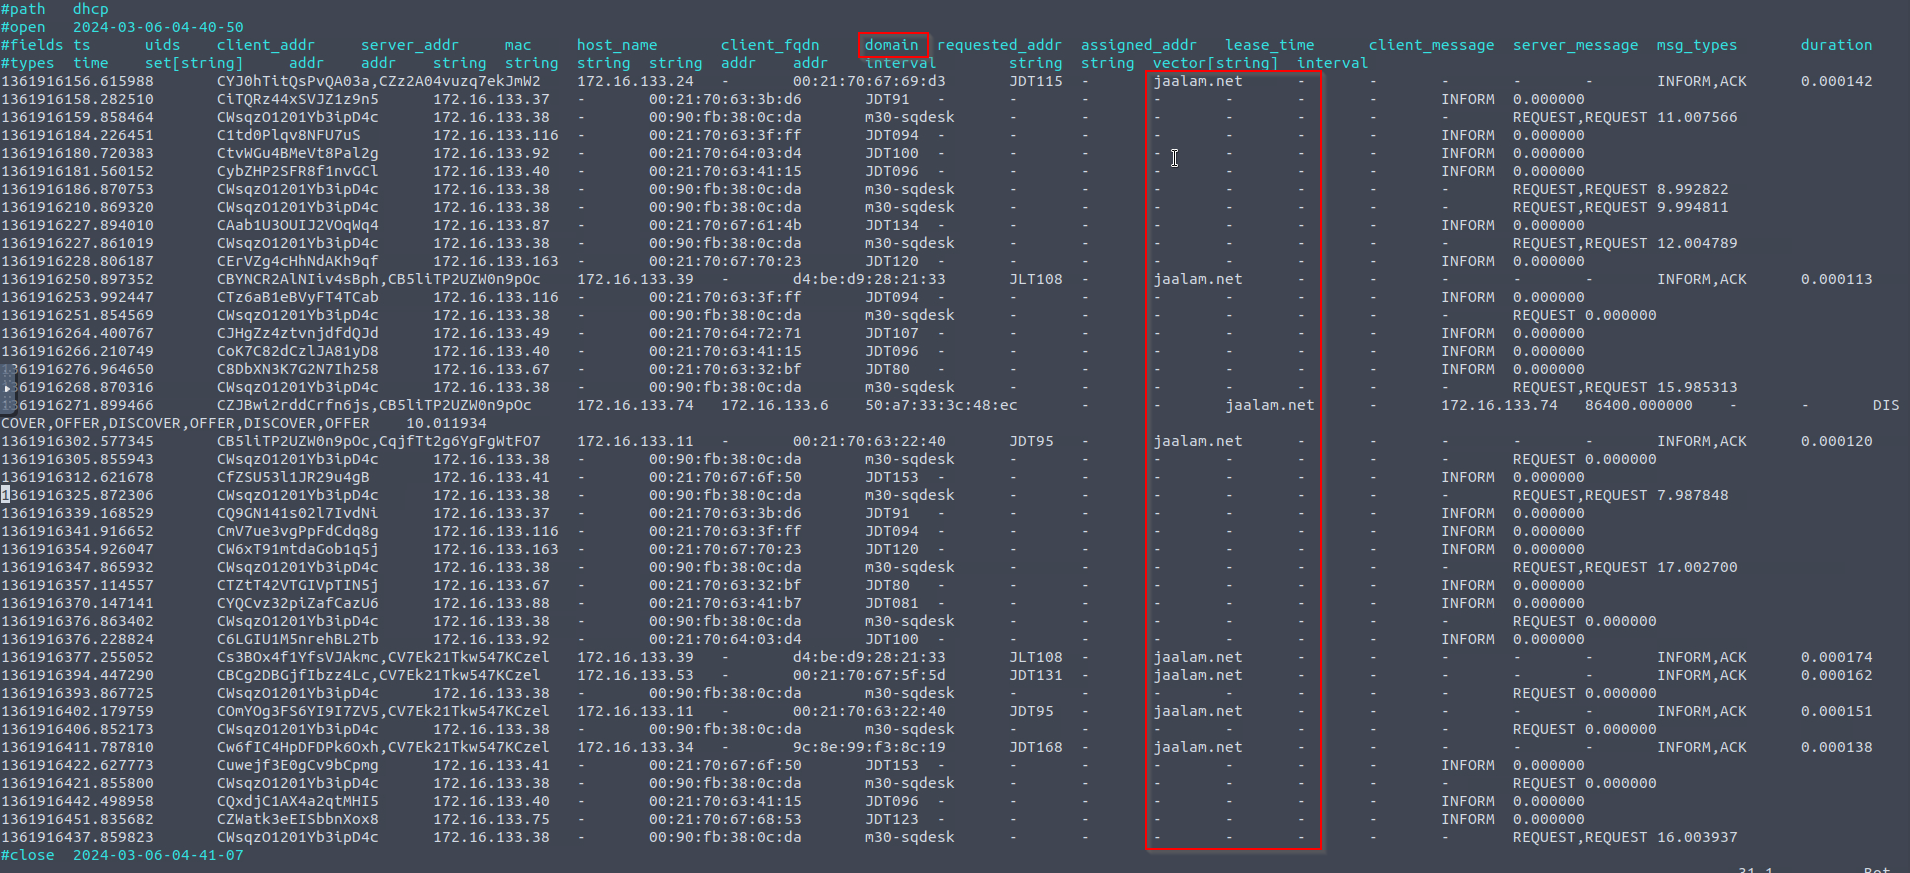
Zeek Logs
Zeekgenerates log files according to the traffic data.- You will have logs for EVERY connection in the wire, including the application level protocols and fields.
Zeekis capable of identifying 50+ logs and categorising them into seven categories.Zeeklogs are well structured and tab-separated ASCII files, so reading and processing them is easy but requires effort.You should be familiar with networking and protocols to correlate the logs in an investigation, know where to focus, and find a specific piece of evidence.
- Each log output consists of multiple fields, and each field holds a different part of the traffic data.
- Correlation is done through a unique value called “
UID”. The “UID” represents the unique identifier assigned to EACH session.
Zeek logs in a nutshell:
| Category | Description | Log Files | |
|---|---|---|---|
| Network | Network Protocols logs | conn.log, dce_rpc.log, dhcp.log, dnp3.log, dns.log, ftp.log, http.log, irc.log, kerberos.log, modbus.log, modbus_register_change.log, mysql.log, ntlm.log, ntp.log, radius.log, rdp.log, rfb.log, sip.log, smb_cmd.log, smb_files.log, smb_mapping.log, smtp.log, snmp.log, socks.log, ssh.log, ssl.log, syslog.log, tunnel.log | |
| Files | File analysis result logs | files.log, ocsp.log, pe.log, x509.log | |
| NetControl | Network control and flow logs | netcontrol.log, netcontrol_drop.log, netcontrol_shunt.log, netcontrol_catch_release.log, openflow.log | |
| Detection | Detection and possible indicator logs | intel.log, notice.log, notice_alarm.log, signatures.log, traceroute.log | |
| Network Observations | Network flow logs | known_certs.log, known_hosts.log, known_modbus.log, known_services.log, software.log | |
| Miscellaneous | Additional logs cover external alerts, inputs and failures | barnyard2.log, dpd.log, unified2.log, unknown_protocols.log, weird.log, weird_stats.log | |
| Zeek Diagnostics | Zeek diagnostic logs cover system messages, actions and some statistics | broker.log, capture_loss.log, cluster.log, config.log, loaded_scripts.log, packet_filter.log, print.log, prof.log, reporter.log, stats.log, stderr.log, stdout.log |
Please refer to Zeek’s official documentation and Corelight log cheat sheet for more information. Although there are multiple log files, some log files are updated daily, and some are updated in each session. Some of the most commonly used logs are explained in the given table.
| Update Frequency | Log Name | Description |
|---|---|---|
| Daily | known_hosts.log | List of hosts that completed TCP handshakes |
| Daily | known_services.log | List of services used by hosts |
| Daily | known_certs.log | List of SSL certificates |
| Daily | software.log | List of software used on the network |
| Per Session | notice.log | Anomalies detected by Zeek |
| Per Session | intel.log | Traffic contains malicious patterns/indicators |
| Per Session | signatures.log | List of triggered signatures |
Brief log usage primer table:
| Overall Info | Protocol-Based | Detection | Observation |
|---|---|---|---|
| conn.log | http.log | notice.log | known_host.log |
| files.log | dns.log | signatures.log | known_services.log |
| intel.log | ftp.log | pe.log | software.log |
| loaded_scripts.log | ssh.log | traceroute.log | weird.log |
- You can categorise the logs BEFORE starting an investigation.
- Thus, finding the evidence/anomaly you are looking for will be easier.
- The given table is a brief example of using multiple log files. You can create your working model or customise the given one.
- Make sure you read each log description and understand the purpose to know what to expect from the corresponding log file.
- Note that these are not the only ones to focus on. Investigated logs are highly associated with the investigation case type and hypothesis, so do not just rely only on the logs given in the example table!
The table shows us how to use multiple logs to identify anomalies and run an investigation by correlating across the available logs:
1
2
3
4
5
6
7
- 'Overall Info': The aim is to review the overall connections, shared files, loaded scripts and indicators at once. This is the first step of the investigation.

- 'Protocol Based': Once you review the overall traffic and find suspicious indicators or want to conduct a more in-depth investigation, you focus on a specific protocol.

- 'Detection': Use the prebuild or custom scripts and signature outcomes to support your findings by having additional indicators or linked actions.

- 'Observation': The summary of the hosts, services, software, and unexpected activity statistics will help you discover possible missing points and conclude the investigation.
Remember, we mention the pros and cons of the Zeek logs at the beginning of this task. Now let’s demonstrate the log viewing and identify the differences between them.
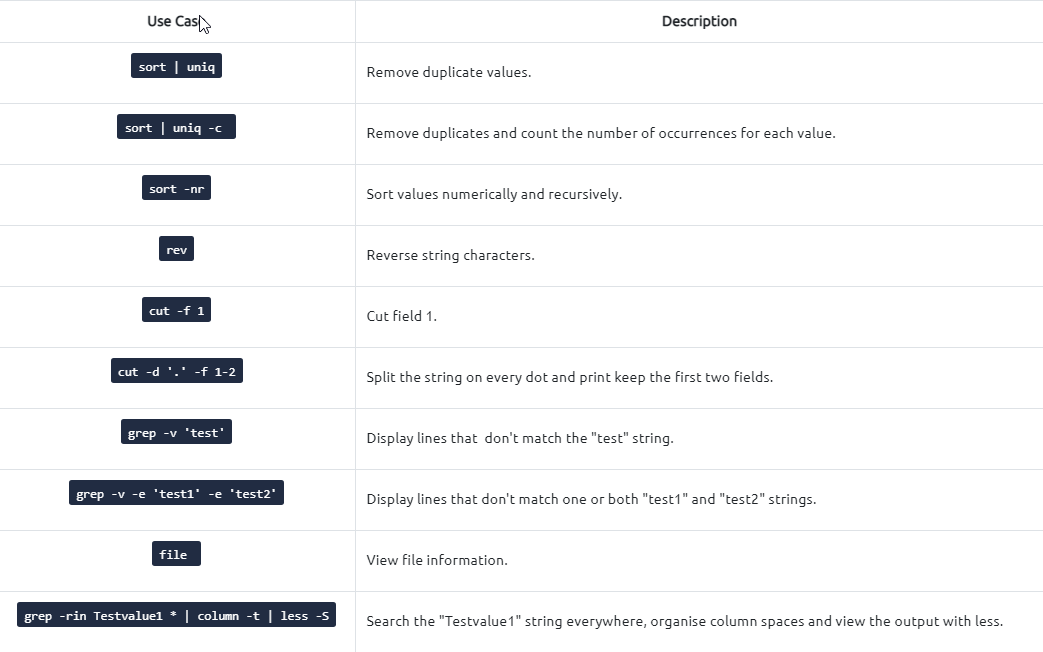
Recall 1: Zeek logs are well structured and tab-separated ASCII files, so reading and processing them is easy but requires effort.
Recall 2: Investigating the generated logs will require command-line tools (cat, cut, grep sort, and uniq) and additional tools (zeek-cut).
Opening a Zeek log with a text editor and built-in commands:
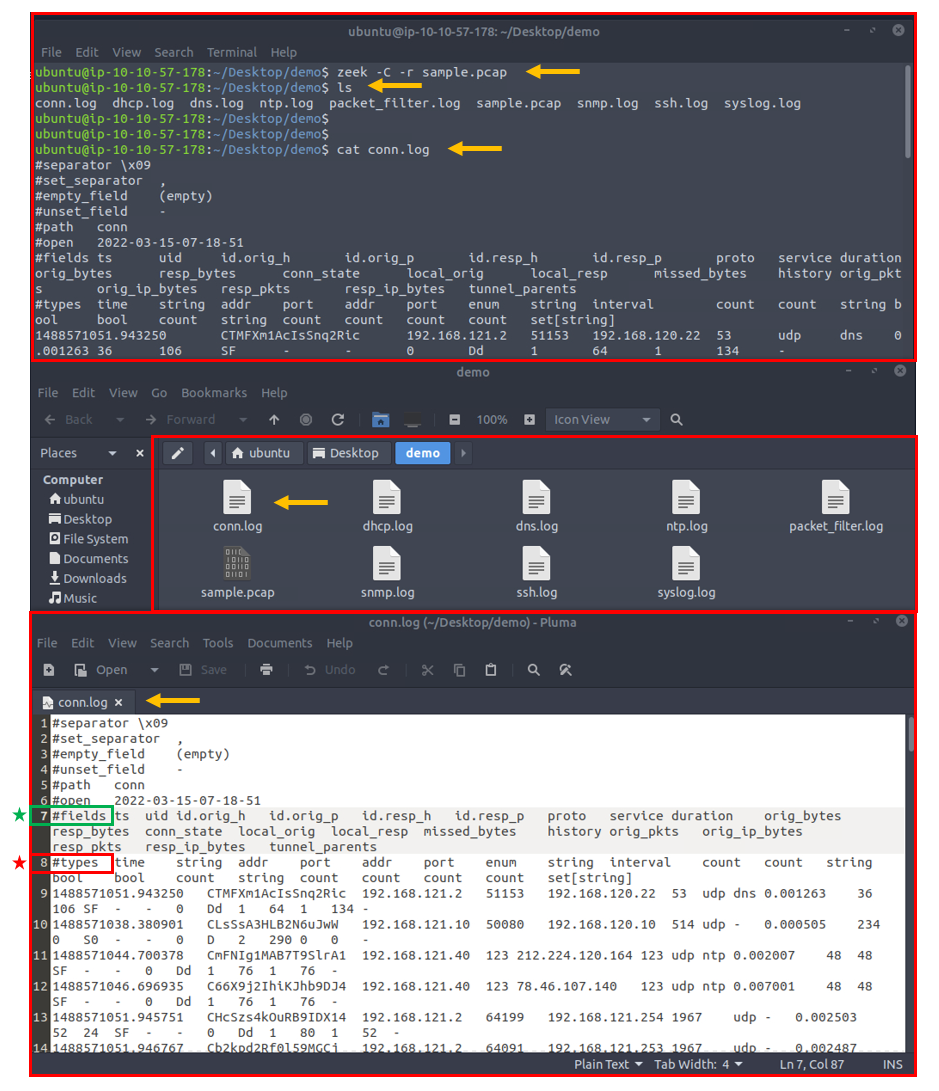
- The above image shows that reading the logs with tools is not enough to spot an anomaly quickly. Logs provide a vast amount of data to investigate and correlate.
- You will need to have technical knowledge and event correlation ability to carry out an investigation.
- It is possible to use
external visualisationandcorrelationtools such asELKandSplunk. We will focus on using and processing the logs with a hands-on approach in this room.
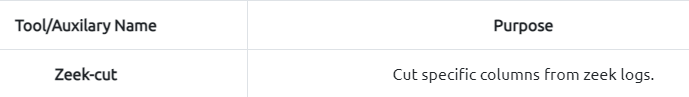
In addition to Linux command-line tools, one auxiliary program called zeek-cut reduces the effort of extracting specific columns from log files.
Each log file provides “field names” in the beginning. This information will help you while using zeek-cut. Make sure that you use the “fields” and not the “types”.
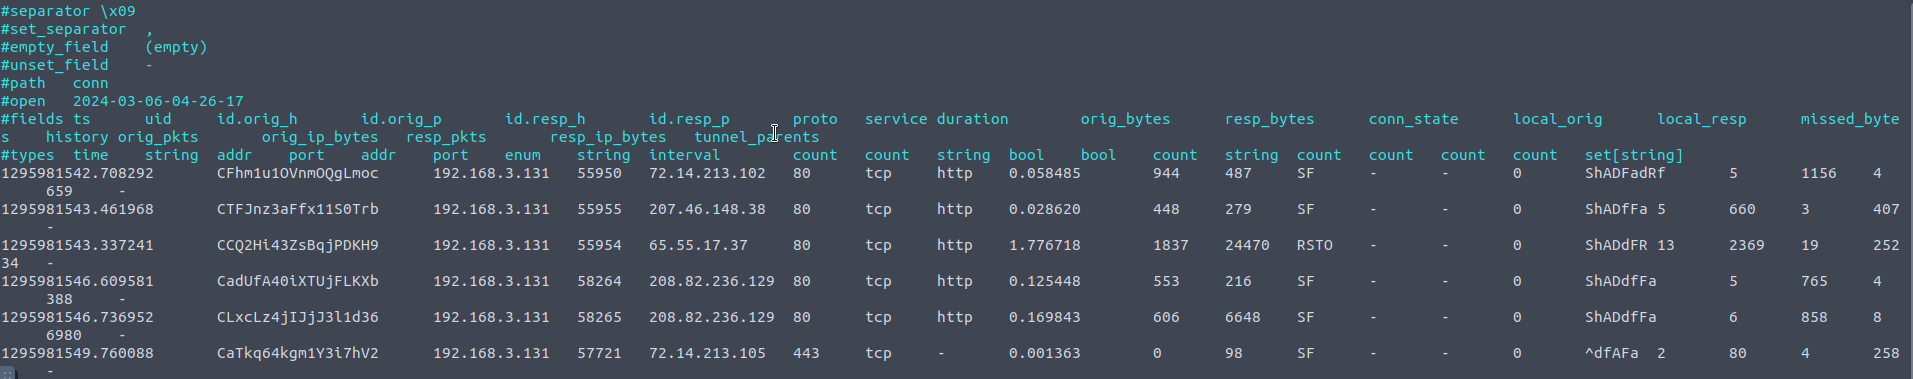
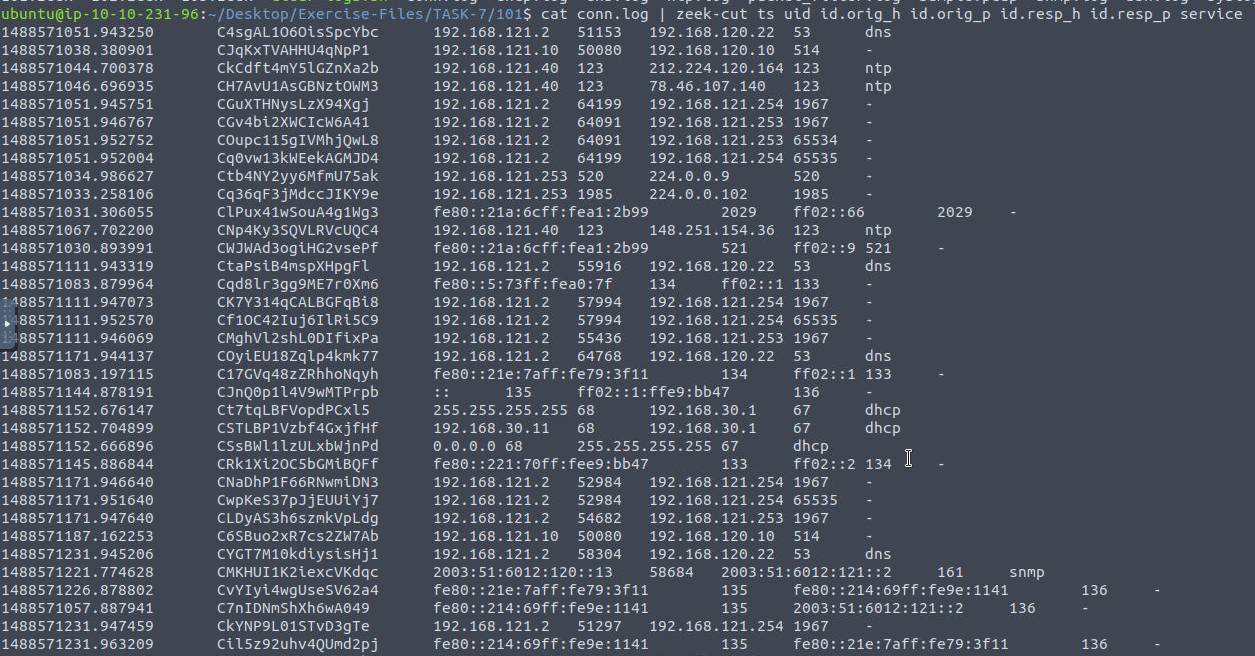
Extract the uid, protocol, source and destination hosts, and source and destination ports from the conn.log
We will first read the logs with the cat command and then extract the event of interest fields with zeek-cut auxiliary to compare the difference.
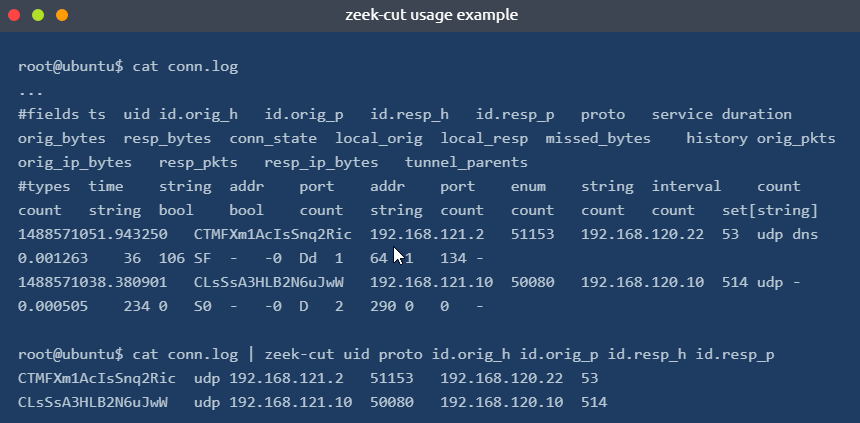
1
$ cat conn.log | zeek-cut uid proto id.orig_h id.orig_p id.resp_h id.resp_p
- As shown in the above output, the “
zeek-cut“ auxiliary provides massive help to extract specific fields with minimal effort. - Now take time to read log formats, practice the log reading/extracting operations and answer the questions.
Questions and Answers section
1
$ zeek -C -r sample.pcap
Output:
-> Logs generated: 8
1
2
3
4
5
6
7
8
- conn.log
- dhcp.log
- dns.log
- ntp.log
- packet_filter.log
- snmp.log
- ssh.log
- syslog.log
- Investigate the
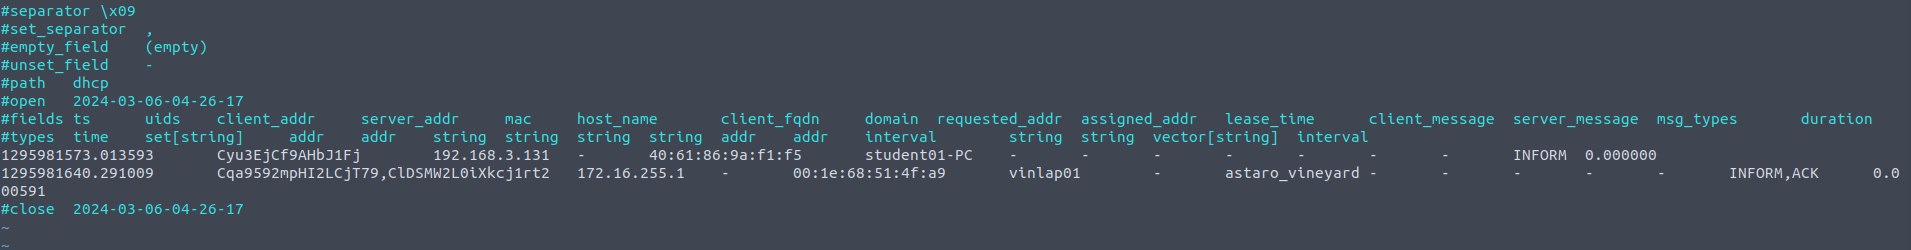
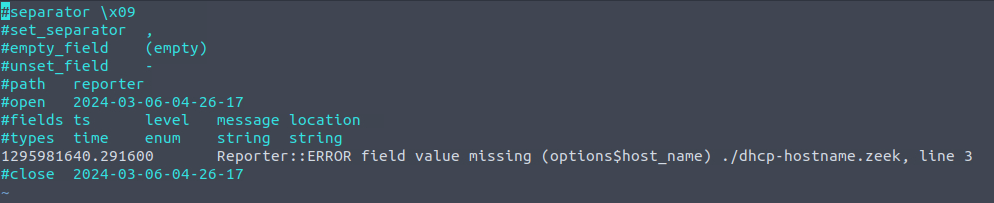
sample.pcapfile. Investigate thedhcp.logfile. What is the available hostname?1
$ cat dhcp.log | zeek-cut host_name
Output: 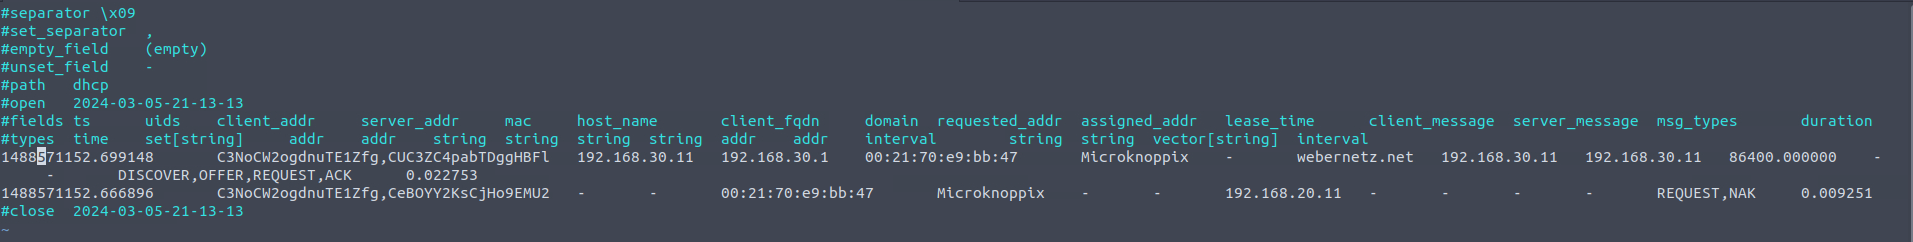
1
- Hostname : Microknoppix

- Investigate the
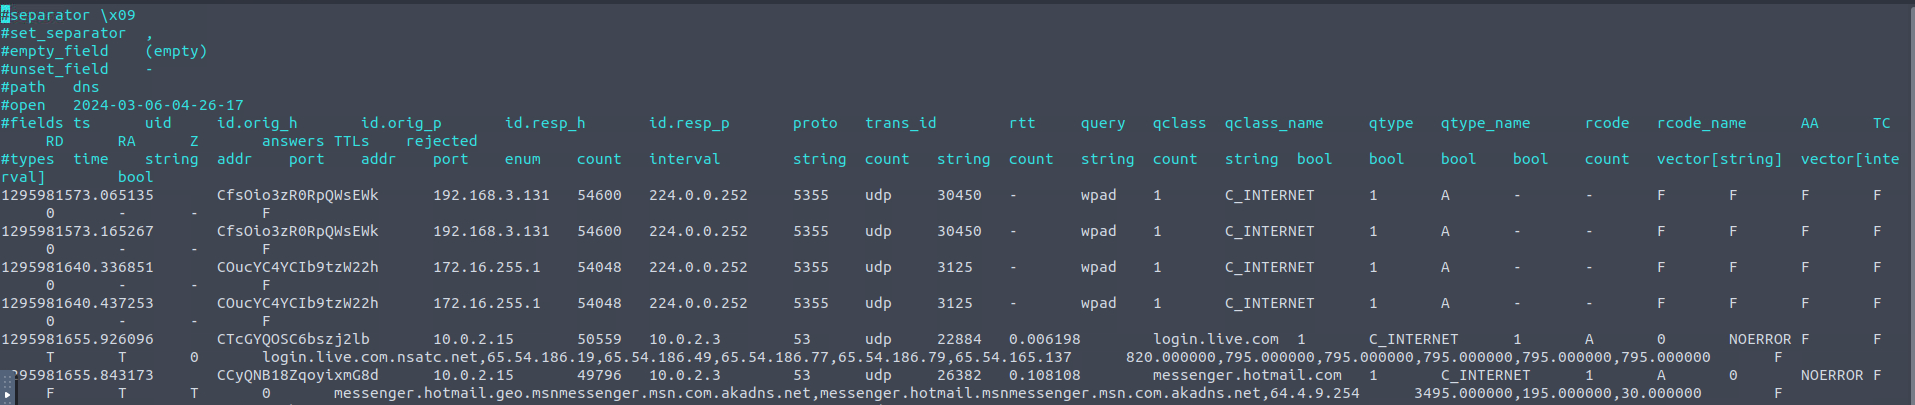
dns.logfile. What is the number of unique DNS queries?21
$ cat dns.log | zeek-cut uid query
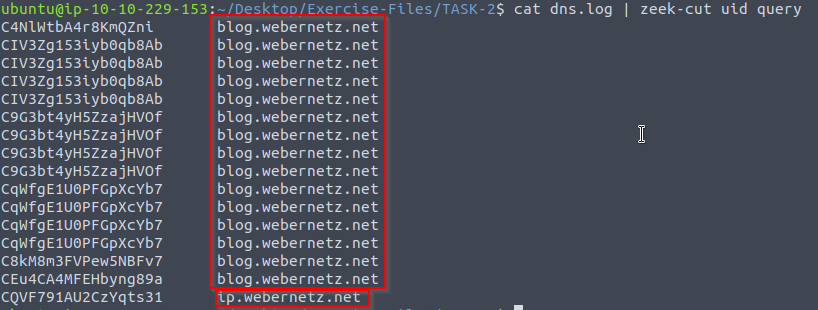
1
- There are 15 DNS queries to the same server and one on another.
- Investigate the
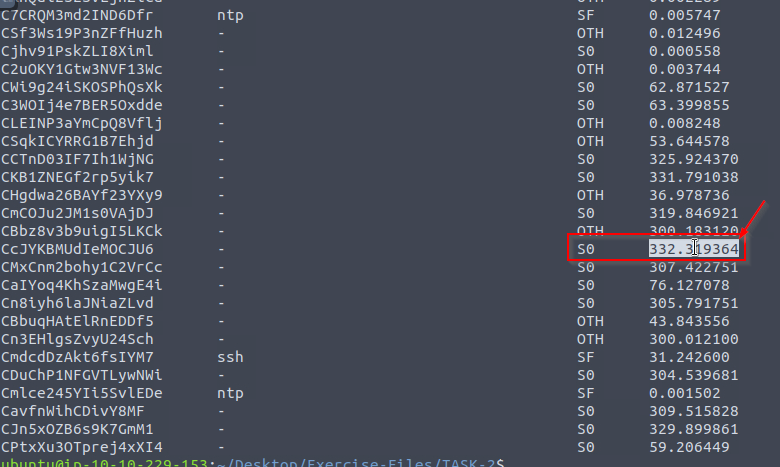
conn.logfile(connection). What is the longest connection duration?1
$ cat conn.log | zeek-cut uid service addr port addr port conn_state duration
CLI Kung-Fu Recall: Processing Zeek Logs
CLI Kung-Fu Recall: Processing Zeek Logs
Graphical User Interfaces (GUI) are handy and good for accomplishing tasks and processing information quickly. There are multiple advantages of GUIs, especially when processing the information visually. However, when processing massive amounts of data, GUIs are not stable and as effective as the CLI (Command Line Interface) tools.
The critical point is: What if there is no “function/button/feature” for what you want to find/view/extract?
- Having the power to manipulate the data at the command line is a crucial skill for analysts.
- Not only in this room but each time you deal with packets, you will need to use command-line tools,
Berkeley Packet Filters (BPF)andregular expressionsto find/view/extract the data you are looking for. - This task provides quick cheat-sheet like information to help you write CLI queries for your event of interest.

Zeek Signatures
- Zeek supports signatures to have rules and event correlations to find noteworthy activities on the network.
- Zeek signatures use low-level pattern matching and cover conditions similar to Snort rules.
- Unlike Snort rules, Zeek rules are not the primary event detection point.
- Zeek has a scripting language and can chain multiple events to find an event of interest.
We focus on the signatures in this task, and then we will focus on Zeek scripting in the following tasks.
Zeek signatures are composed of three logical paths:
1
2
3
  - Signature id
  - Conditions
  - Action
The signature breakdown is shown in the table below:
1
2
3
4
5
6
7
8
- 'Signature ID' : Unique signature name
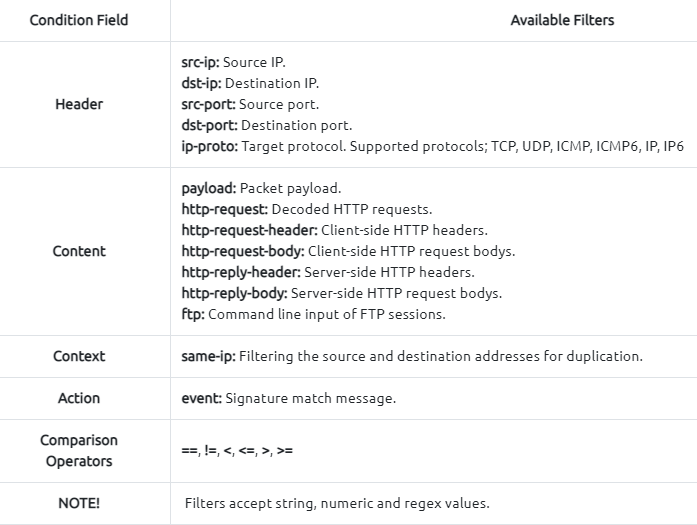
- 'Conditions' :
- 'Header' - Filtering the packet headers for specific source and destination addresses, protocol and port numbers.
- 'Content' - Filtering the packet payload for specific value/pattern
- 'Action' :
- 'Default action' : Create the 'signatures.log' file in case of a signature match
- 'Additional action' : Trigger a Zeek script
Now let’s dig more into the Zeek signatures. The below table provides the most common conditions and filters for the Zeek signatures:
Running Zeek with signature file:
1
$ zeek -C -r sample.pcap -s sample.sig
1
2
3
- '-C' : ignore checksum errors
- '-r' : Read pcap file
- '-s' : use signature file
| Zeek signatures use the “.sig” extension. | | ——————————————- |
Example Signature: Cleartext Submission of Password
Example signature to detect HTTP cleartext passwords:
1
2
3
4
5
6
7
8
9
10
11
12
signature http-password {
	ip-proto == tcp
	dst-port == 80
	payload /.*password.*/
	event "Cleartext Password Found!"
}

# signature: Signature name.
# ip-proto: Filtering TCP connection.
# dst-port: Filtering destination port 80.
# payload: Filtering the "password" phrase.
# event: Signature match message.
Remember, Zeek signatures support regex. Regex “.*” matches any character zero or more times. The rule will match when a “password” phrase is detected in the packet payload.
Once the match occurs, Zeek will generate an alert and create additional log files (signatures.log and notice.log):
1
$ zeek -C -r http.pcap -s http-password.sig
1
cat notice.log | zeek-cut id.orig_h id.resp_h msg
1
cat signatures.log | zeek-cut src_addr dest_addr sig_id event_msg
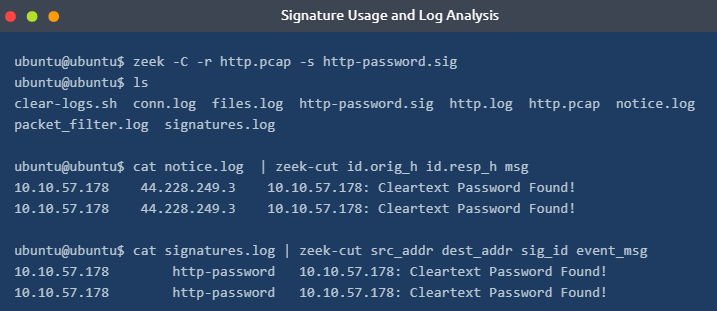
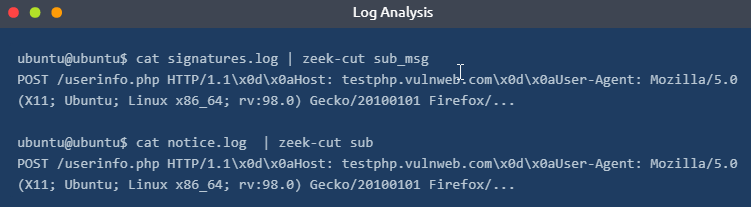
As shown in the above terminal output, the
signatures.logandnotice.logprovide basic details and the signature message.Both of the logs also have the application banner field.
So it is possible to know where the signature match occurs. Let’s look at the application banner!
1
$ cat signatures.log | zeek-cut sub_msg
1
$ cat notice.log | zeek-cut sub
Example: FTP Brute-force
FTP traffic rule:
1
2
3
4
5
signature ftp-admin {
	ip-proto == tcp
	ftp /.*USER.*dmin.*/
	event "FTP Admin Login Attempt!"
}
- This time, we will use the FTP content filter to investigate command-line inputs of the FTP traffic.
- The aim is to detect FTP “
admin” login attempts. - This basic signature will help us identify the admin login attempts and have an idea of possible admin account abuse or compromise events.
Run the Zeek with the signature and investigate the 'signatures.log' and 'notice.log'
1
2
3
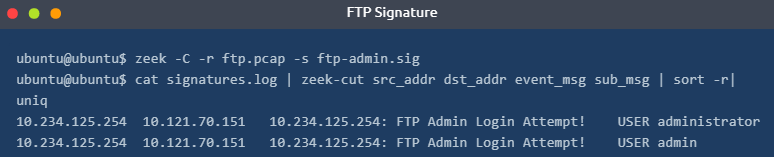
$ zeek -C -r ftp.pcap -s ftp-admin.sig
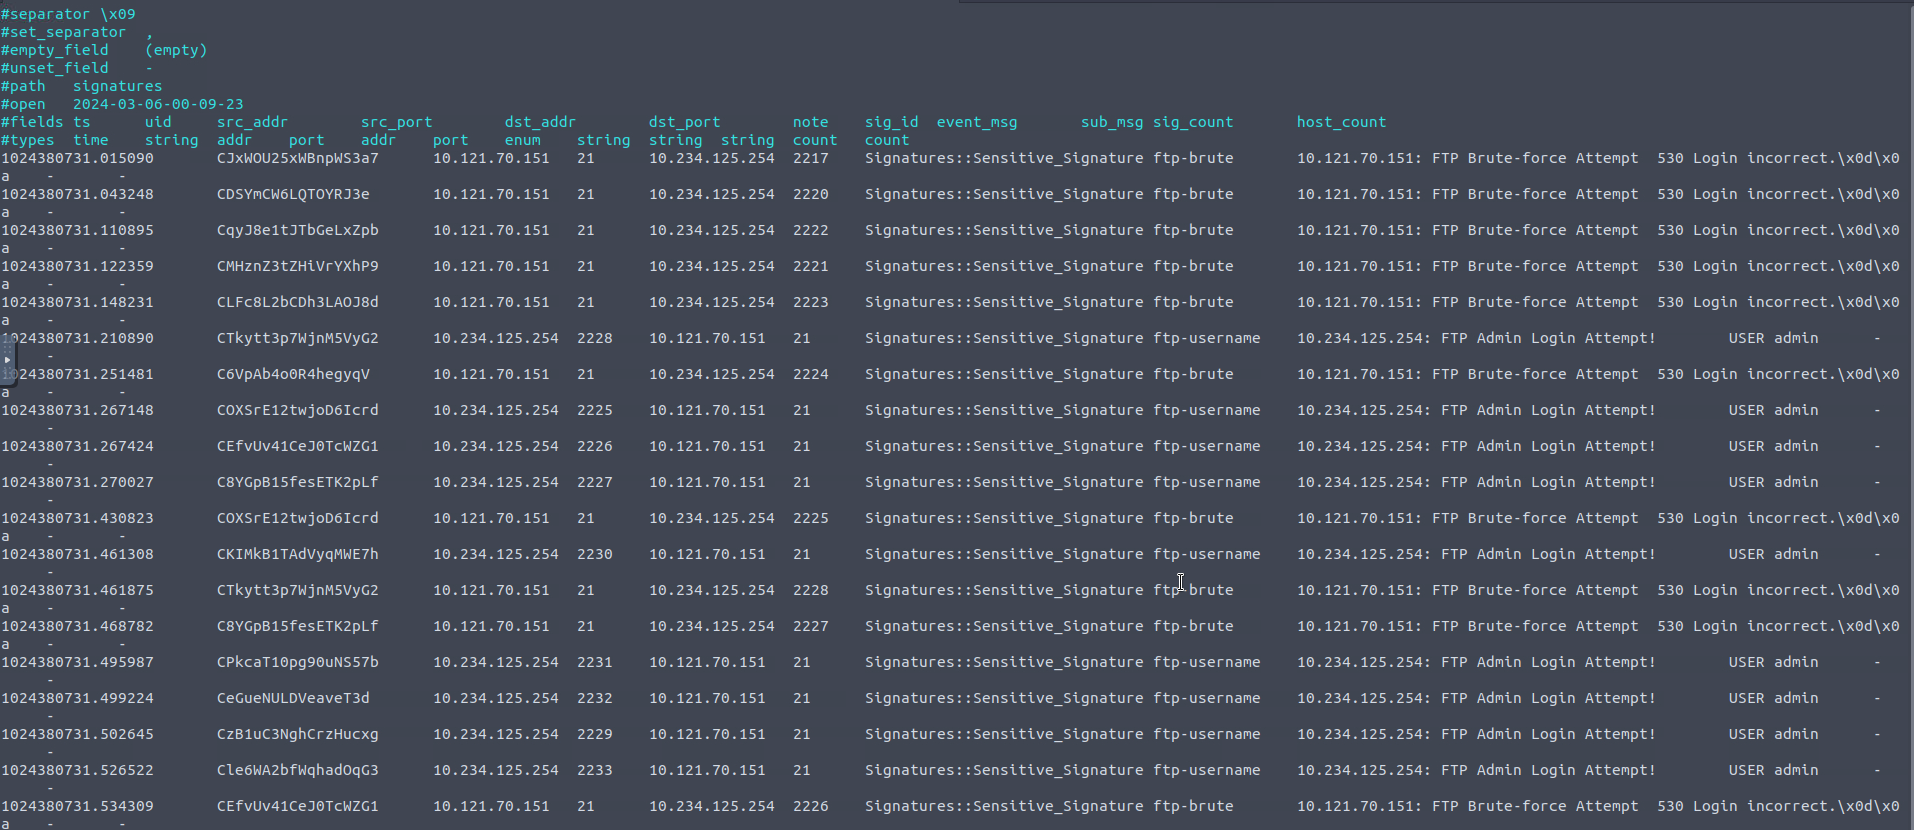
$ cat signatures.log | zeek-cut src_addr dst_addr event_msg sub_msg | sort -r | uniq
1
- Shows that there is a bruteforce attempt on the admin account for the FTP service
- This signature can be considered a case signature.
- While it is accurate and works fine, we need global signatures to detect the “
known threats/anomalies”. - We will need those case-based signatures for significant and sophistical anomalies like zero-days and insider attacks in the real-life environment.
- Having individual rules for each case will create dozens of logs and alerts and cause missing the real anomaly. The critical point is logging logically, not logging everything.
We can improve our signature by not limiting the focus only to an admin account. In that case, we need to know how the FTP protocol works and the default response codes. If you don’t know these details, please refer to RFC documentation.
1
- This part is very important. You can say the same when creating Snort rules since knowing what 'normal' is for a protocol, it is easy to detect what's not.
Create a rule and make it detect all possible FTP brute-force attempts
1
2
3
4
5
signature ftp-brute {
	ip-proto == tcp
	payload /.*530.*Login.*incorrect.*/
	event "FTP Brute-force Attempt"
}
1
2
- This signature detects any failed login attempt on the FTP service
- We are able to know if its a failed login attempt because FTP responds to the user a 530 response code when it happens
Zeek signature files can consist of multiple signatures.
- Therefore we can have one file for each protocol/situation/threat type.
- Let’s demonstrate this feature in our global rule: ```c signature ftp-username { ip-proto == tcp ftp /.USER./ event “FTP Username Input Found!” }
signature ftp-brute { ip-proto == tcp payload /.530.Login.incorrect./ event “FTP Brute-Force Attempt!” }
1
2
3
4
5
6
7
8
9
10
11
12
13
- Let's merge both of the signatures in a single file.
- We will have two different signatures, and they will generate alerts according to match status.
- The result will show us how we benefit from this action.
- Again, we will need the "`CLI Kung-Fu`" skills to extract the event of interest.
- This rule should show us two types of alerts and help us to correlate the events by having "`FTP Username Input`" and "`FTP Brute-force Attempt`" event messages:
```c
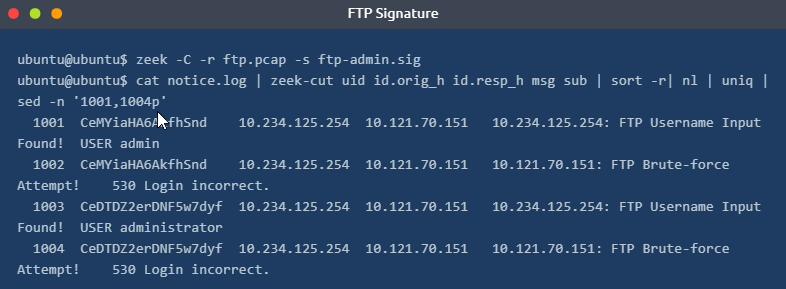
$ zeek -C -r ftp.pcap -s ftp-admin.sig
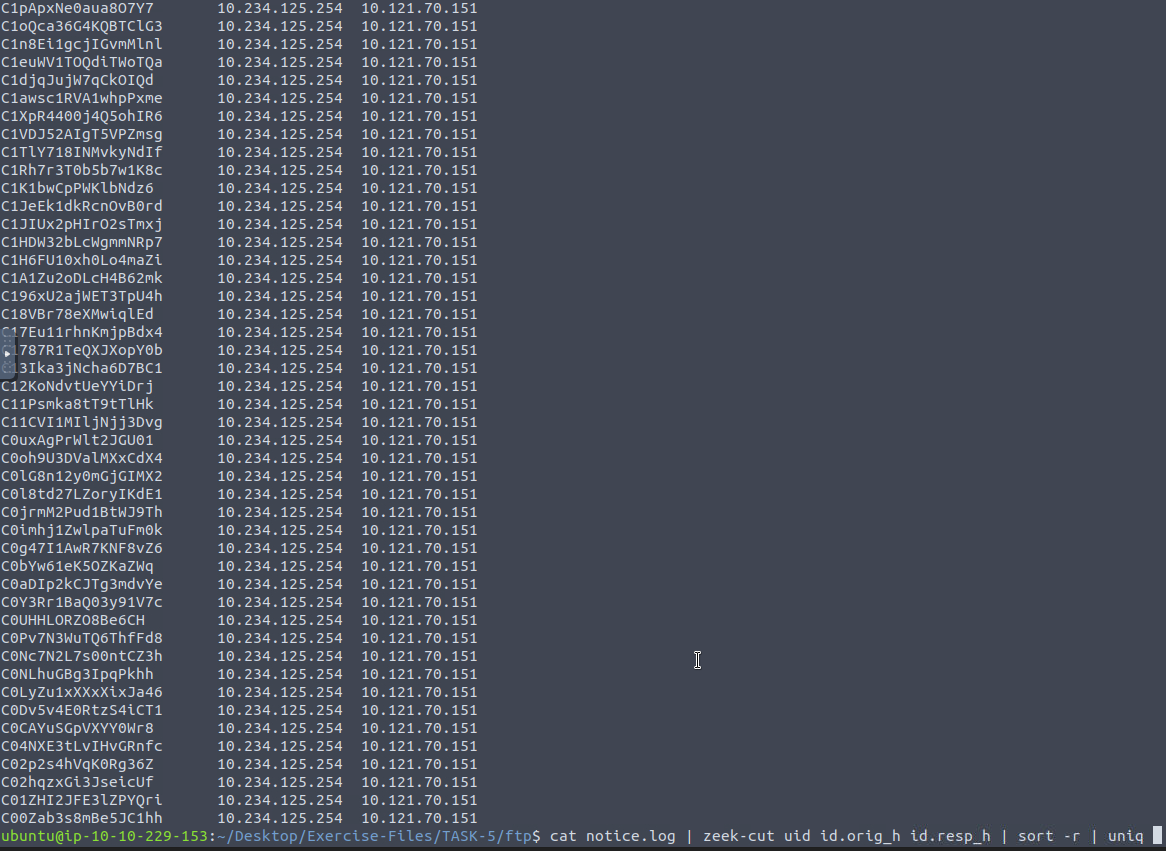
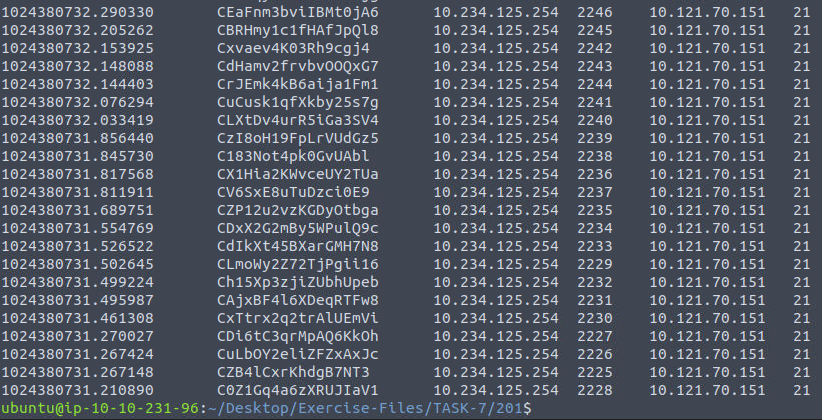
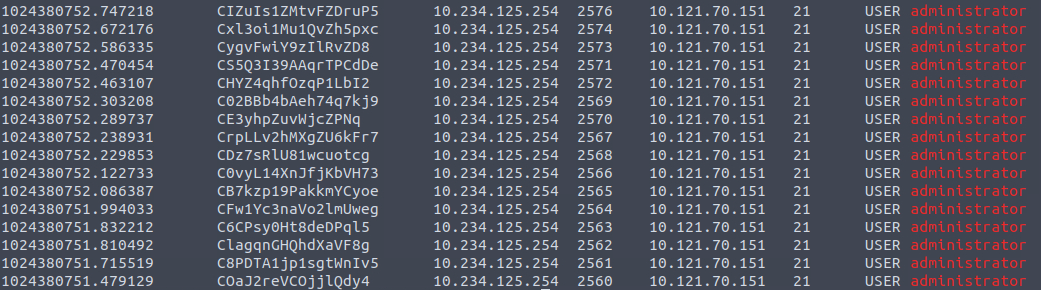
- Let’s investigate the logs. We’re grepping the logs in range
1001-1004to demonstrate that the first rule matches two different accounts (adminandadministrator):1
$ cat notice.log | zeek-cut uid id.orig_h id.resp_h msg sub | sort -r | nl | uniq | sed -n '1001,1004p'
Output:
Snort Rules in Zeek?
While Zeek was known as Bro, it supported Snort rules with a script called snort2bro, which converted Snort rules to Bro signatures. However, after the rebranding, workflows between the two platforms have changed. The official Zeek document mentions that the script is NO LONGER SUPPORTED and is not a part of the Zeek distribution.
Questions and Answers:
- Investigate the
http.pcapfile. Create theHTTPsignature shown in the task and investigate the pcap. What is the source IP of the first event?1
$ zeek -C -r http.pcap -s http-password.sig
Inside the http-password.sig:
1
2
3
4
5
6
signature http-password {
    ip-proto == tcp
    dst-port == 80
    payload /??????????????/
    event ""
}
After modifying the http-password.sig:
1
2
3
4
5
6
signature http-password {
    ip-proto == tcp
    dst-port == 80
    payload /.*password*./
    event "HTTP login brute-force attack attempt!"
}
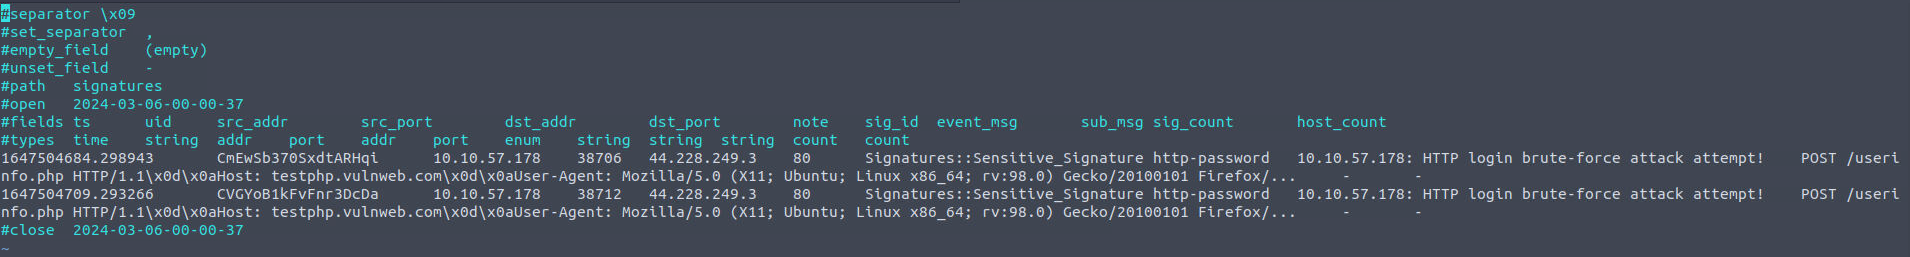
Output from signatures.log:
1
2
3
- Notice that the 'sig-id' column represents the name of the signature name we created
- Why would the creator put '/.*password.*/' in the payload section? What's the basis?
	- There's no basis. I think there's just an assumption that a keyword 'password' will be in the payload as any other login forms?
Generated logs:

Command Executed:
1
$ cat conn.log | zeek-cut ts uid id.orig_h id.org_p id.resp_h id.resp_p service duration
Output: 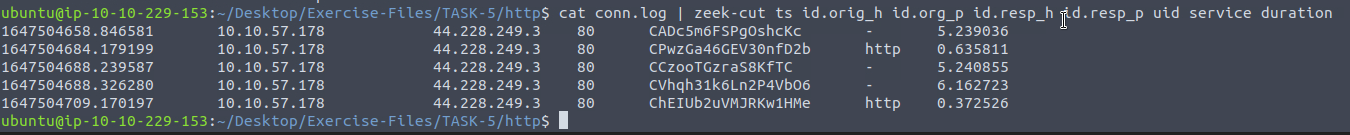
1
- Answer: 10.10.57.178
- What is the
source portof the second event?1
$ cat http.log | zeek-cut ts uid id.orig_h id.orig_p id.resp_h id.resp_p method host uri username password
Output:

1
- Answer: Port 38712
- Investigate the
conn.log.
What is the total number of the sent and received packets from source port 38706?
Command to execute:
1
$ cat conn.log | zeek-cut ts uid id.orig_h id.orig_p id.resp_h id.resp_p service orig_pkts resp_pkts conn_state
Output:

- Create the global rule shown in the task and investigate the
ftp.pcapfile. Investigate thenotice.log. What is the number of unique events?
Signature file for FTP:
1
2
3
4
5
6
7
8
9
10
11
signature ftp-username {
    ip-proto == tcp
    ftp /.*USER.*dmin.*/
	event "FTP Admin Login Attempt!"
}

signature ftp-brute {
    ip-proto == tcp
    payload /.*530.*Login.*incorrect.*/
	event "FTP Brute-force Attempt"
}
Command to execute:
1
$ zeek -C -r ftp.pcap -s ftp-bruteforce.sig
Output:
1
- Lots of matches!
Filtered output:
1
- There are 1413 unique events!
- What is the number of
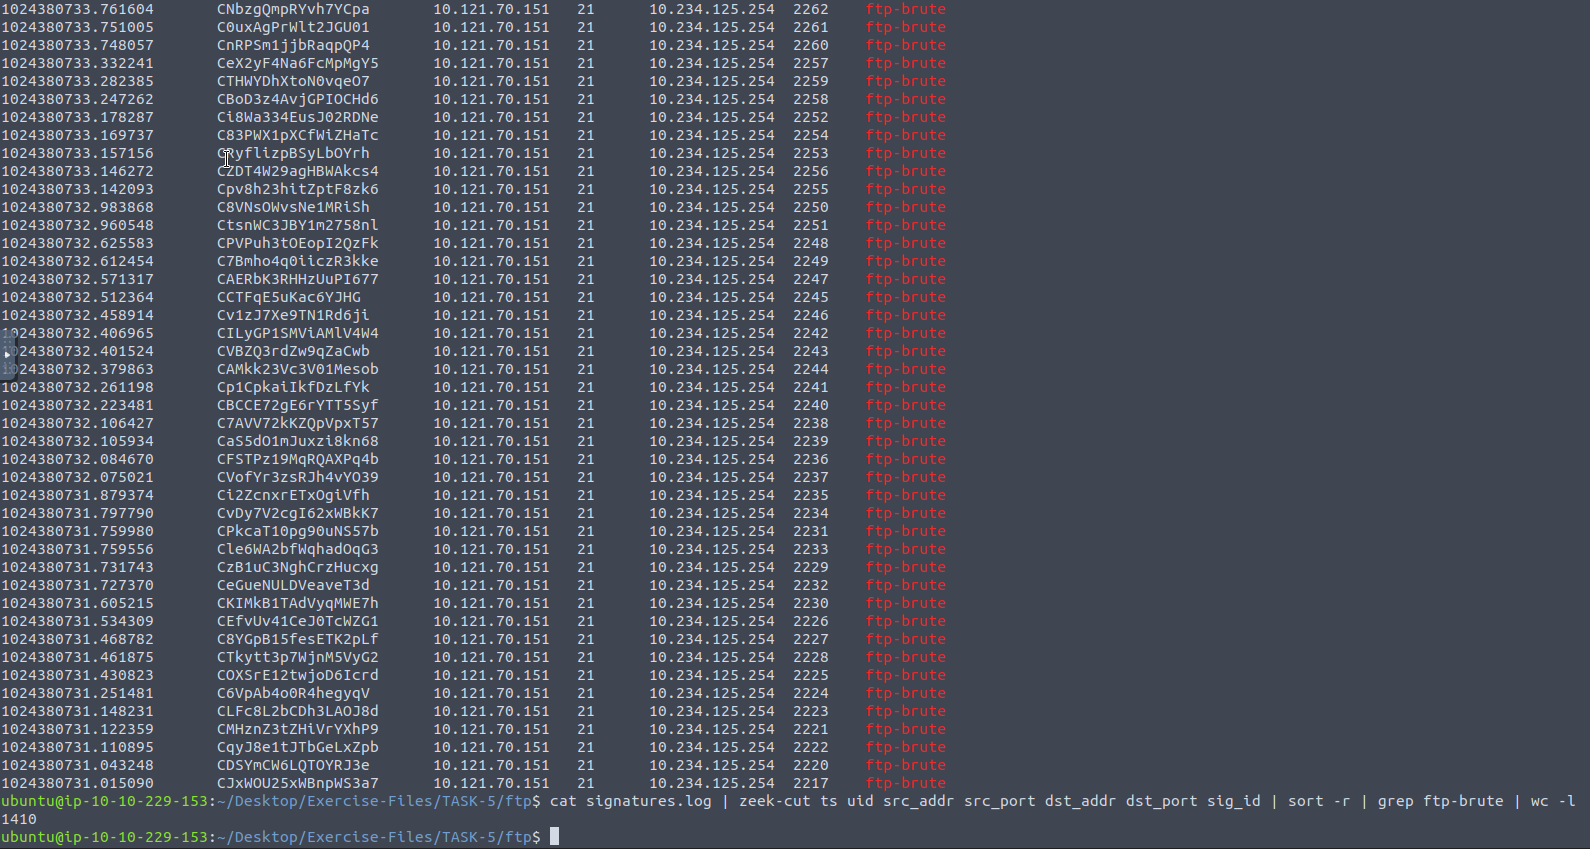
ftp-brutesignature matches? Command to execute:1
$ cat signatures.log | zeek-cut ts uid src_addr src_port dst_addr dst_port sig_id | sort -r | grep ftp-brute | wc -l
Filtered Output:
Zeek Scripts : Fundamentals
Zeek Scripts
- Zeek has its own event-driven scripting language, which is as powerful as high-level languages and allows us to investigate and correlate the detected events.
- Since it is as capable as high-level programming languages, you will need to spend time on Zeek scripting language in order to become proficient.
- In this room, we will cover the basics of Zeek scripting to help you understand, modify and create basic scripts. Note that scripts can be used to apply a policy and in this case, they are called
policy scripts.
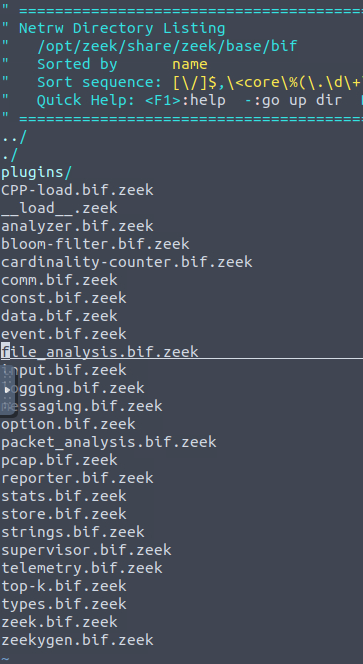
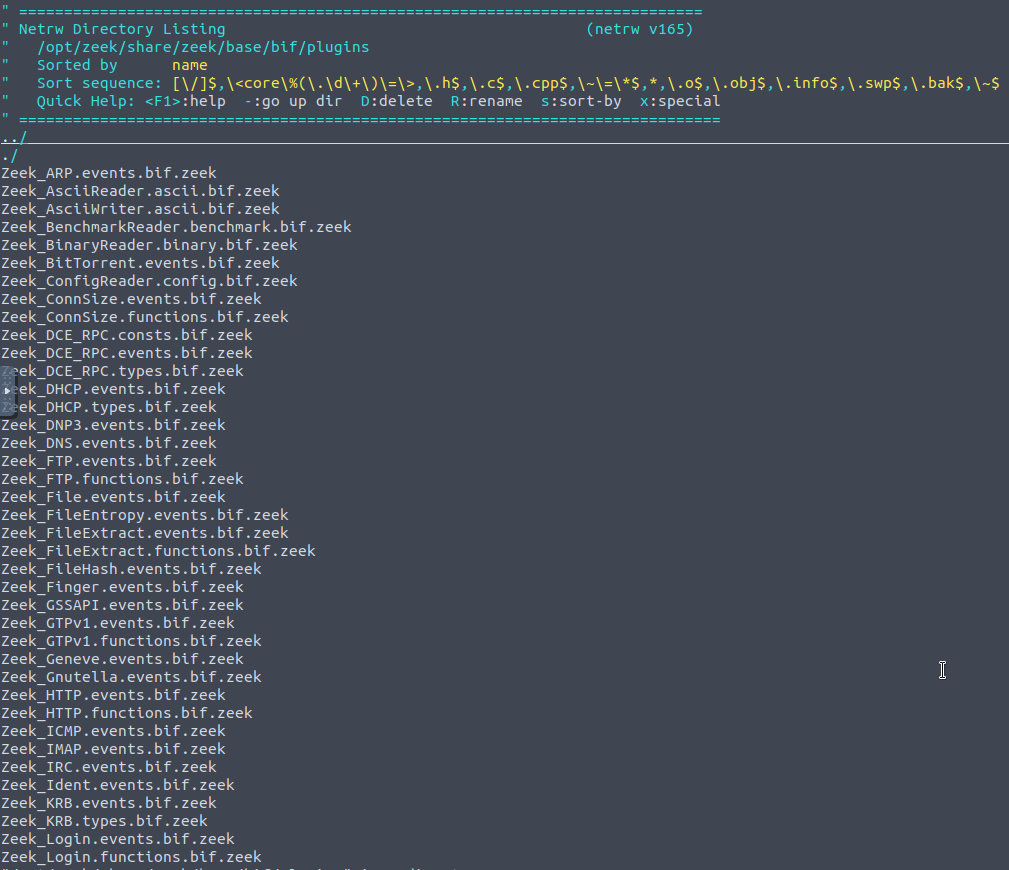
Important Zeek directory/file absolute paths:
1
2
3
4
5
6
7
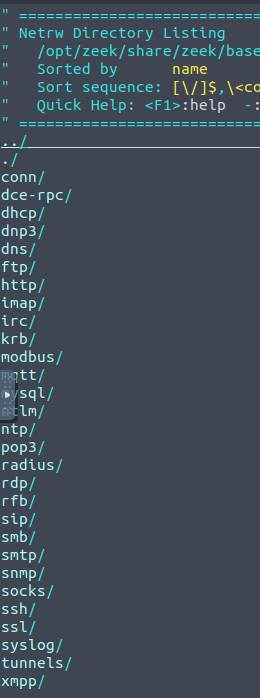
- "/opt/zeek/share/zeek/base" : Zeek has base scripts installed by default, and these are not intended to be modified.
- "/opt/zeek/share/zeek/site" : User-generated or modified scripts should be located in a specific path.
- "/opt/zeek/share/zeek/policy" : Policy scripts are located in a specific path.
- "/opt/zeek/share/zeek/site/local.zeek" : Like Snort, to automatically load/use a script in live sniffing mode, you must identify the script in the Zeek configuration file. You can also use a script for a single run, just like the signatures.
Zeek scripts use the ”
.zeek“ extension.Do not modify anything under the “
zeek/base” directory. User-generated and modified scripts should be in the “zeek/site” directory.You can call scripts in live monitoring mode by loading them with the command
load @/script/pathorload @script-nameinlocal.zeekfile.Zeek is event-oriented, not packet-oriented! We need to use/write scripts TO HANDLE the event of interest.
Running Zeek with signature:
1
$ zeek -C -r sample.pcap -s sample.sig
GUI vs Scripts
Have you ever thought about automating tasks in Wireshark, tshark or tcpdump? Zeek provides that chance to us with its scripting power.
- Scenario: Extract all available DHCP hostnames from a pcap file.
- Action to take: We have several options like using
tcpdump,Wireshark,tsharkorZeek.
Let’s see Wireshark on the stage first. You can have the same information with Wireshark. However, while this information can be extracted using Wireshark is not easy to transfer the data to another tool for processing.
Tcpdump and tshark are command-line tools, and it is easy to extract and transfer the data to another tool for processing and correlating.
Extracting hostnames with Tcpdump and Tshark:
1
ubuntu@ubuntu$ sudo tcpdump -ntr smallFlows.pcap port 67 or port 68 -e -vv | grep 'Hostname Option' | awk -F: '{print $2}' | sort -nr | uniq | nl
1
ubuntu@ubuntu$ tshark -V -r smallFlows.pcap -Y "udp.port==67 or udp.port==68" -T fields -e dhcp.option.hostname | nl | awk NF
Script: dhcp-hostname.zeek
1
2
3
event dhcp_message (c: connection, is_orig: bool, msg: DHCP::Msg, options: DHCP::Options) {
	print options$host_name; // Extracts DHCP hostnames
}
1
- While tcpdump and tshark can provide similar results, transferring uncontrolled data through multiple pipelines is not much preferred.
Using this Zeek script:
1
$ zeek -C -r smallFlows.pcap dhcp-hostname.zeek
1
- With this output, we can tell that the script works fine with Zeek.
- Zeek is helpful for data extraction and correlation.
Zeek Official Training Platform: https://try.bro.org/#/?example=hello
-> What are the ways to trigger the rule conditions in Zeek?
1
1. Built-In Function (BiF) + protocols
1
- After the trigger, Zeek will extract the data based on the rule
- Find more supported protocol for Zeek in here:
[Zeek Script Index — Book of Zeek (git/master)](https://docs.zeek.org/en/master/script-reference/scripts.html)
Customized Script Locations
1
2
3
4
5
1. /opt/zeek/share/zeek/base/bif

2. /opt/zeek/share/zeek/base/bif/plugins

3. /opt/zeek/share/zeek/base/protocols
(1) First script: /opt/zeek/share/zeek/base/bif
(2) Second script: /opt/zeek/share/zeek/base/bif/plugins
(3) Third script: /opt/zeek/share/zeek/base/protocols
Questions and Answer section:
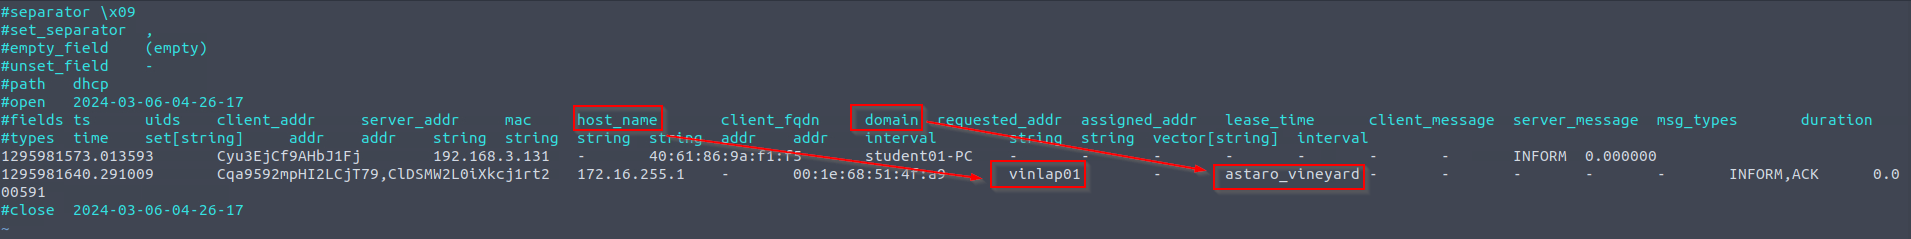
- Investigate the
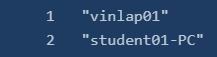
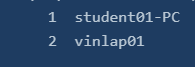
smallFlows.pcapfile. Investigate thedhcp.logfile. What is the domain value of the “vinlap01“ host?
Zeek Script inside:
1
2
3
4
event dhcp_message (c: connection, is_orig: bool, msg: DHCP::Msg, options: DHCP::Options)
{
	print options$host_name;
}
Here are the kinds of logs generated from the Zeek script:
1
2
3
4
5
6
7
8
9
10
11
12
- conn.log (connection)
- dhcp.log
- dns.log
- dpd.log
- files.log
- http.log
- packet_filter.log
- reporter.log
- snmp.log
- ssl.log
- weird.log
- x509.log
What’s inside the log files:
- conn.log:
- dhcp.log:
- dns.log:
- dpd.log:
- files.log:
- http.log:
- packet_filter.log
- reporter.log
- snmp.log
- ssl.log
- weird.log:
- x509.log : also contains the certificate of the connection
Command executed:
1
$ zeek -C -r smallFlows.pcap dhcp-hostname.zeek
Output:
- Investigate the
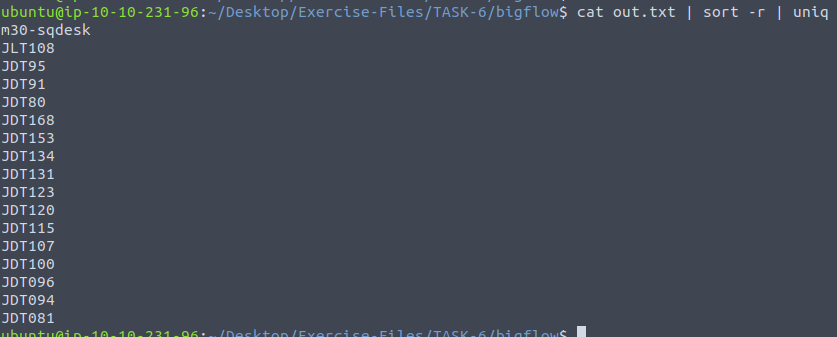
bigFlows.pcapfile. Investigate thedhcp.logfile. What is the number of identified unique hostnames?
Command executed:
1
$ zeek -C -r bigFlows.pcap dhcp-hostname.zeek
Output:
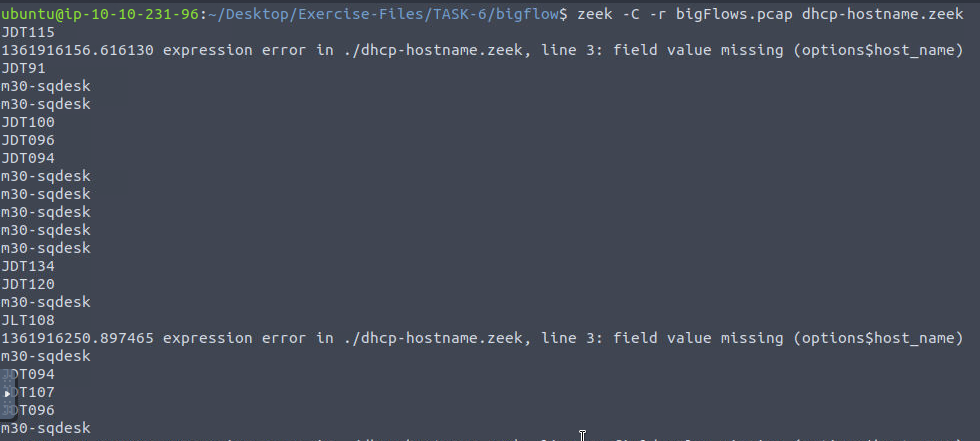
In order: 17
- Investigate the
dhcp.logfile. What is the identified domain value?
Zeek Scripts: Scripts and Signatures
Scripts 101 : Write Basic Scripts
Sample Script:
1
2
3
4
5
6
7
8
9
event zeek_init()
	{ print ("Started Zeek!"); }

event zeek_done()
	{ print ("Stopped Zeek!"); }

# zeek_init: Do actions once Zeek starts its process.
# zeek_done: Do activities once Zeek finishes its process.
# print: Prompt a message on the terminal.
1
- When activated, just prints a message
Parts of a script:
1
2
3
4
5
6
- operators
- types
- attributes
- declarations
- statements, and
- directives
Running Zeek script:
1
- Zeek will create logs in the working directory separately from the scripts tasks.
1
2
event new_connection(c: connection)
	{ print c; }
- In this script, we are requesting details of a connection and extracting them without any filtering or sorting of the data.
- To accomplish this, we are using the “
new_connection” event(note that this is just a name). - This event is automatically generated for each new connection.
- This script provides bulk information on the terminal.
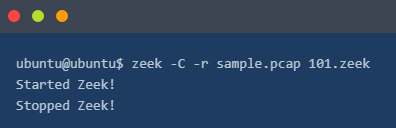
Running Zeek with the script:
1
$ zeek -C -r sample.pcap 102.zeek
Organized view:
1
2
3
4
5
6
7
8
9
[id=[orig_h=192.168.121.40, orig_p=123/udp, resp_h=212.227.54.68, resp_p=123/udp],

orig=[size=48, state=1, num_pkts=0, num_bytes_ip=0, flow_label=0, l2_addr=00:16:47:df:e7:c1],

resp=[size=0, state=0, num_pkts=0, num_bytes_ip=0, flow_label=0, l2_addr=00:00:0c:9f:f0:79],

start_time=1488571365.706238, duration=0 secs, service={}, history=D, uid=CajwDY2vSUtLkztAc, tunnel=,

vlan=121, inner_vlan=, dpd=, dpd_state=, removal_hooks=, conn=, extract_orig=F, extract_resp=F, thresholds=, dce_rpc=, dce_rpc_state=, dce_rpc_backing=, dhcp=, dnp3=, dns=, dns_state=, ftp=, ftp_data_reuse=F, ssl=, http=, http_state=, irc=, krb=, modbus=, mysql=, ntlm=, ntp=, radius=, rdp=, rfb=, sip=, sip_state=, snmp=, smb_state=, smtp=, smtp_state=, socks=, ssh=, syslog=]
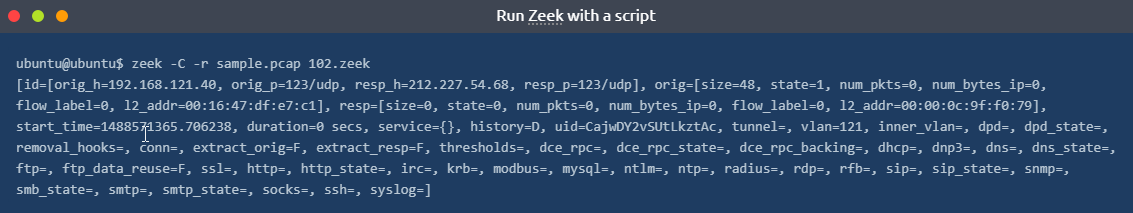
Creating a Zeek script with filtered output based on events of interest:
1
2
3
4
5
6
7
8
9
10
11
12
13
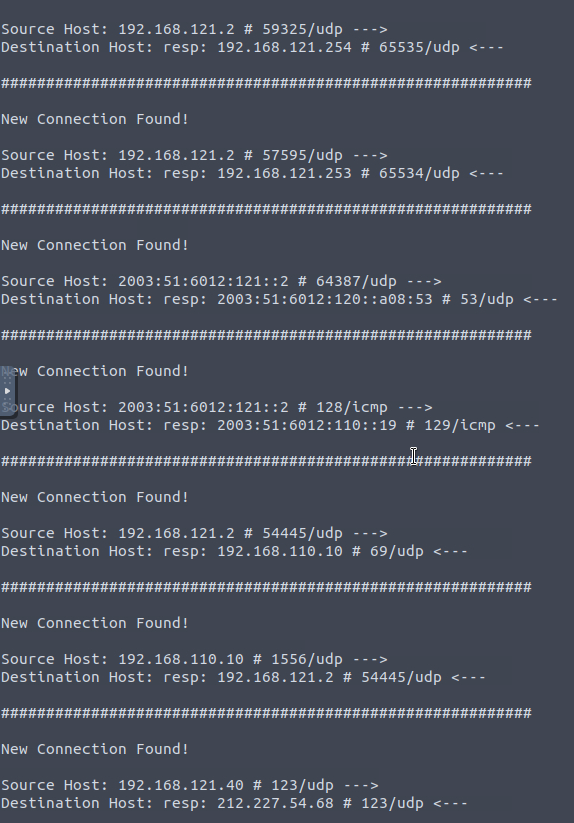
event new_connection(c: connection)
{
print ("###########################################################");
print ("");
print ("New Connection Found!");
print ("");
print fmt ("Source Host: %s # %s --->", c$id$orig_h, c$id$orig_p);
print fmt ("Destination Host: resp: %s # %s <---", c$id$resp_h, c$id$resp_p);
print ("");
}
# %s: Identifies string output for the source.
# c$id: Source reference field for the identifier.
1
- Think of 'c$id' like its a pointer Or the '.' operator on structs.
What it will print:
1
2
Source Host: <connection><id>-><request-source-ip> # <connection><id>-><request-source-port>
Destination Host: resp: <connection><id>-><response-dest-ip> # <connection><id>-><response-dest-port>
1
- The script above creates logs and prompts each source and destination address for each connection.
Another script that extracts specific information from packets
Running Zeek with a script:
1
$ zeek -C -r sample.pcap 103.zeek
Output:
The above output shows that we successfully extract specific information from the events. Remember that this script extracts the event of interest (in this example, a new connection), and we still have logs in the working directory. We can always modify and optimise the scripts at any time.
Scripts 201: Use Scripts and Signatures together
A script that detects if our previously created “ftp-admin” rule has a hit:
1
2
3
4
5
6
7
event signature_match (state: signature_state, msg: string, data: string)
{
if (state$sig_id == "ftp-admin")
	{
		print ("Signature hit! --> #FTP-Admin ");
	}
}
1
- One step closer to event correlation
Review of the script:
1
2
3
4
5
signature ftp-admin {
	ip-proto == tcp
	ftp /.*USER.*admin.*/
	event "FTP Username Input Found!"
}
Running the script:
1
2
3
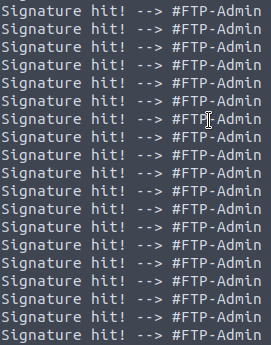
ubuntu@ubuntu$ zeek -C -r ftp.pcap -s ftp-admin.sig 201.zeek
Signature hit! --> #FTP-Admin Signature hit! --> #FTP-Admin
Signature hit! --> #FTP-Admin Signature hit! --> #FTP-Admin
The above output shows that we successfully combined the signature and script. Zeek processed the signature and logs then the script controlled the outputs and provided a terminal output for each rule hit.
1
- Basically, this is how Zeek ingests the log we provided it with and how it utilize the signatures as well to know how it should remind us based on the log it receives.
Scripts 202 | Load Local Scripts
Load all local scripts:
- We mentioned that Zeek has base scripts located in ”
/opt/zeek/share/zeek/base”. - You can load all local scripts identified in your “
local.zeek” file. - Note that base scripts cover multiple framework functionalities.
- You can load all base scripts by easily running the
localcommand.1
$ zeek -C -r ftp.pcap local
- The above output demonstrates how to run all base scripts using the “
local” command. - Look at the above terminal output; Zeek provided additional log files this time.
Loaded scripts generated:
1 2 3 4
- loaded_scripts.log - capture_loss.log - notice.log - stats.log
- Note that, in our instance, 465 scripts loaded and used by using the “
local” command. - However, Zeek doesn’t provide log files for the scripts doesn’t have hits or results.
Load Specific Scripts
- Another way to load scripts is by identifying the script path.
- In that case, you have the opportunity of loading a
specific scriptORframework. - Let’s go back to FTP brute-forcing case.
- We created a script that detects multiple admin login failures in previous steps.
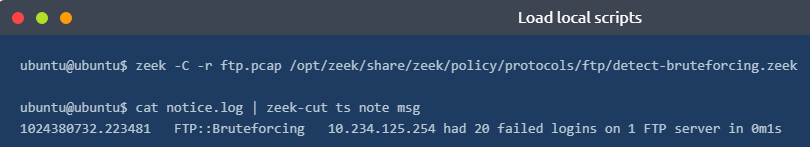
Zeekhas an FTP brute-force detection script as well.- Now let’s use the default script and identify the differences:
1
$ zeek -C -r ftp.pcap /opt/zeek/share/zeek/policy/protocols/ftp/detect-bruteforcing.zeek
Breakdown of the script:
1
2
3
4
5
6
7
8
9
10
11
12
13
14
15
16
17
18
19
20
21
22
23
24
25
26
27
28
29
30
31
32
33
34
35
36
37
38
39
40
41
42
43
44
45
46
47
48
49
50
51
52
53
54
55
56
57
58
59
60
61
62
63
64
##! FTP brute-forcing detector, triggering when too many rejected usernames or
##! failed passwords have occurred from a single address.
# Libraries are included in the script through `@load` and a namespace is defined with `module`
@load base/protocols/ftp
@load base/frameworks/sumstats
@load base/utils/time
# Namespace is 'FTP'
module FTP;
# Custom variables being provided (`export`) as part of the script’s namespace
export {
redef enum Notice::Type += {
## Indicates a host bruteforcing FTP logins by watching for too
## many rejected usernames or failed passwords.
Bruteforcing
};
## How many rejected usernames or passwords are required before being
## considered to be bruteforcing.
const bruteforce_threshold: double = 20 &redef;
## The time period in which the threshold needs to be crossed before
## being reset.
const bruteforce_measurement_interval = 15mins &redef;
}
event zeek_init()
{
local r1: SumStats::Reducer = [$stream="ftp.failed_auth", $apply=set(SumStats::UNIQUE), $unique_max=double_to_count(bruteforce_threshold+2)];
SumStats::create([$name="ftp-detect-bruteforcing",
$epoch=bruteforce_measurement_interval,
$reducers=set(r1),
$threshold_val(key: SumStats::Key, result: SumStats::Result) =
{
return result["ftp.failed_auth"]$num+0.0;
},
$threshold=bruteforce_threshold,
$threshold_crossed(key: SumStats::Key, result: SumStats::Result) =
{
local r = result["ftp.failed_auth"];
local dur = duration_to_mins_secs(r$end-r$begin);
local plural = r$unique>1 ? "s" : "";
local message = fmt("%s had %d failed logins on %d FTP server%s in %s", key$host, r$num, r$unique, plural, dur);
NOTICE([$note=FTP::Bruteforcing,
$src=key$host,
$msg=message,
$identifier=cat(key$host)]);
}]);
}
# This is the instruction to take for a specific event which in this case is the server's
# reply to a client FTP authentication request
event ftp_reply(c: connection, code: count, msg: string, cont_resp: bool)
{
local cmd = c$ftp$cmdarg$cmd;
if ( cmd == "USER" || cmd == "PASS" )
{
if ( FTP::parse_ftp_reply_code(code)$x == 5 )
SumStats::observe("ftp.failed_auth", [$host=c$id$orig_h], [$str=cat(c$id$resp_h)]);
}
}
1
- Reference used for the script breakdown: [The Basics — Book of Zeek (git/master)](https://docs.zeek.org/en/master/scripting/basics.html)
![[{9} Zeek Script Basics (detour)]]
Output:
1
$ zeek -C -r ftp.pcap /opt/zeek/share/zeek/policy/protocols/ftp/detect-bruteforcing.zeek
Questions and Answers section:
- Investigate the
sample.pcapfile with103.zeekscript. Investigate the terminal output. What is the number of the detected new connections? Command Executed:
1
$ zeek -C -r sample.pcap 103.zeek
Output:
Log files generated:

1
2
3
4
5
6
7
8
- conn.log
- dhcp.log
- dns.log
- ntp.log
- packet_filter.log
- snmp.log
- ssh.log
- syslog.log
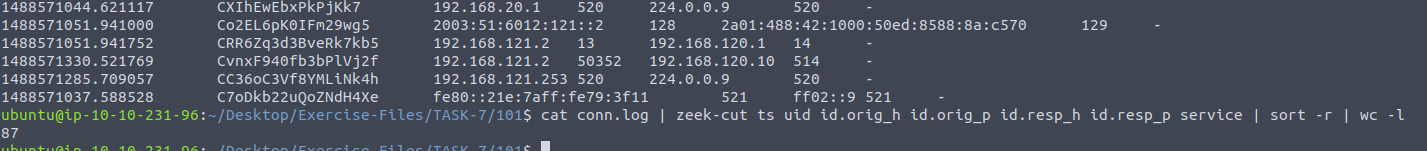
Extracting important information from conn.log:
1
$ cat conn.log | zeek-cut ts uid id.orig_h id.orig_p id.resp_h id.resp_p service | sort -r | wc -l
- Investigate the
ftp.pcapfile withftp-admin.sigsignature and201.zeekscript. Investigate thesignatures.logfile. What is the number of signature hits?
Command Executed:
1
$ zeek -C -r ftp.pcap 201.zeek -s ftp-admin.sig
Output:
Logs Generated:

Extracting important information from signatures.log:
1
$ cat signatures.log | zeek-cut ts uid src_addr src_port dst_addr dst_port | sort -r | wc -l
Getting the number of signature hits:

- Investigate the
signatures.logfile. What is the total number of “administrator” username detections?
Getting the number of signature hits to user 'administrator':
1
$ cat signatures.log | zeek-cut ts uid src_addr src_port dst_addr dst_port sub_msg | sort -r | grep administrator
Output:

- Investigate the
ftp.pcapfile with all local scripts, and investigate theloaded_scripts.logfile. What is the total number of loaded scripts?
Command Executed:
1
$ zeek -C -r ftp.pcap local
Output:
Getting the number of loaded scripts for this pcap:
1
$ cat loaded_scripts.log | wc -l

1
- Excluding the first nine lines, we got 498.
Navigate to ~/Desktop/Exercise-Files/TASK-7/202
- Investigate the
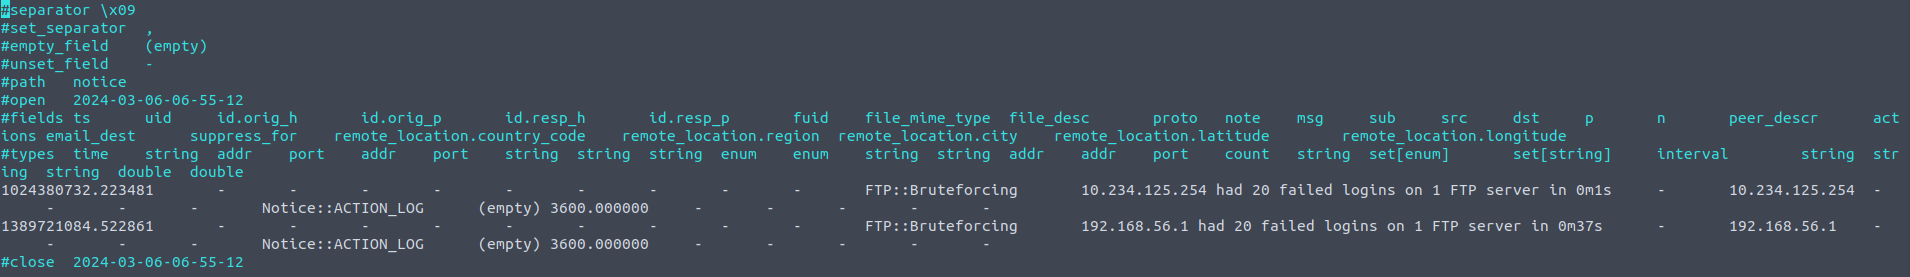
ftp-brute.pcapfile with “/opt/zeek/share/zeek/policy/protocols/ftp/detect-bruteforcing.zeek“ script. Investigate thenotice.logfile. What is the total number of brute-force detections?
1
$ zeek -C -r ftp.pcap /opt/zeek/share/zeek/policy/protocols/ftp/detect-bruteforcing.zeek
Checking notice.log for the total number of brute-force detections:
1
- There are 20 login attempts on the FTP server
Zeek Scripts : Frameworks
Scripts 203 | Load Frameworks
Zeek has 15+ frameworks that help analysts to discover the different events of interest. In this task, we will cover the common frameworks and functions. You can find and read more on the prebuilt scripts and frameworks by visiting Zeek’s online book here.
File Framework | Hashes
- Not all framework functionalities are intended to be used in CLI mode.
- The majority of them are used in
scripting. - You can easily see the usage of frameworks in scripts by calling a specific framework as
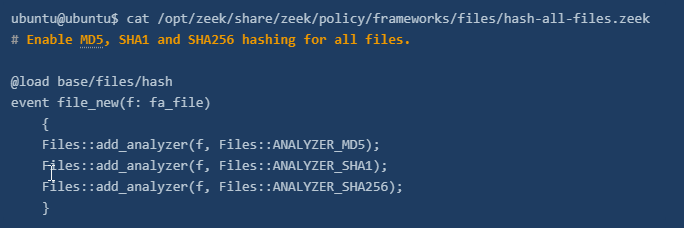
load @ $PATH/base/frameworks/framework-name. - Now, let’s use a prebuilt function of the file framework and have
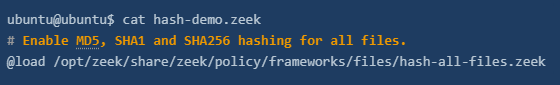
MD5,SHA1andSHA256hashes of the detected files. - We will call the “
File Analysis” framework’s “hash-all-files” script to accomplish this. - Before loading the scripts, let’s look at how it works.
Viewing File Frameworks:
Executing the script and investigate the files.log:
1
2
3
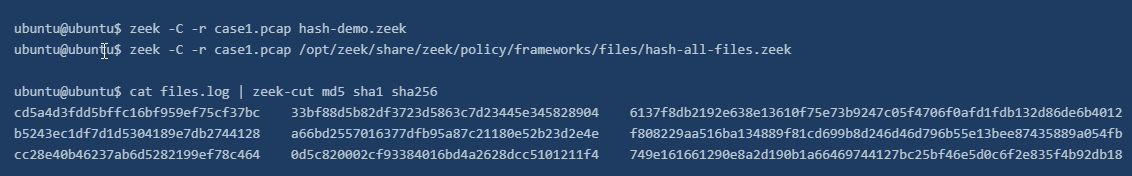
$ zeek -C -r case1.pcap hash-demo.zeek
$ zeek -C -r case1.pcap /opt/zeek/share/zeek/policy/frameworks/files/hash-all-files.zeek
$ cat files.log | zeek-cut md5 sha1 sha256
Output:
1
2
- Both of the scripts provided the same result
- One is loaded via '@load' method and the other is already a built-in Zeek script!
File Framework: Extract Files
Zeek script for extracting files:
1
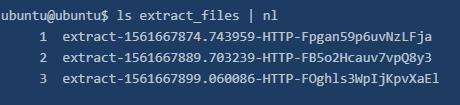
$ zeek -C -r case1.pcap /opt/zeek/share/zeek/policy/frameworks/files/extract-all-files.zeek
Output:
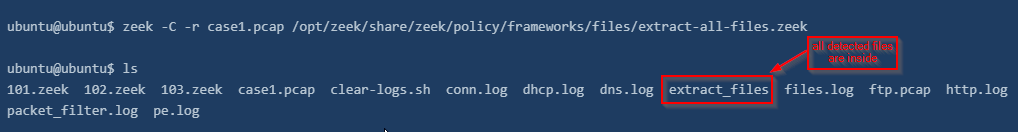
Interacting with the files extracted:
1
- 'nl' just shows the line numbers
Checking the file types:
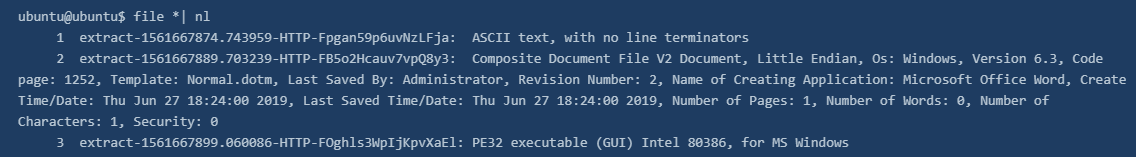
- Zeek RENAMES extracted files.
- The name format consists of four values that come from
conn.logandfiles.logfiles: ```c - default “
extract” keyword, - timestamp value (
ts), - protocol (
source), and - connection id (
conn_uids) ```
Investigating files.log : focus on the .exe and correlate this finding by searching its connection id (conn_uids)
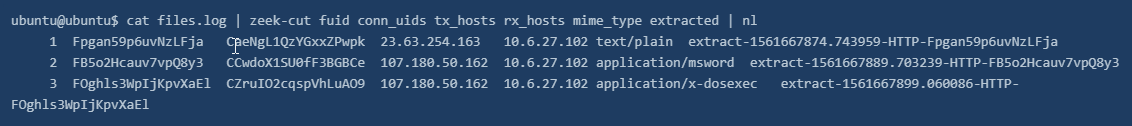
Three files extracted from the traffic capture:
1
$ cat files.log | zeek-cut fuid conn_uids tx_hosts rx_hosts mime_type extracted | nl
Get more information about the extracted .exe file:
1
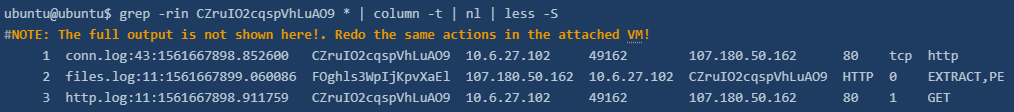
$ grep -rin CZruIO2cqspVhLuAO9 * | column -t | nl | less -S
1
 - From this output, it also tells you how the .exe files has been transferred inside(or out?) of the network (http, EXTRACT/PE, GET)
The above terminal output shows us that the connection id linked with
.exeappears in:1 2 3
- conn.log - files.log and - http.log files
- Given example demonstrates how to filter some fields and correlate the findings with the rest of the logs.
We’ve listed the:
1
2
3
4
  - Source and destination addresses,
  - File and connection id numbers,
  - MIME types, and
  - File names
- Up to now, provided outputs and findings show us that record number three is a
.exefile, and other log files provide additional information.
Notice Framework | Intelligence
The intelligence framework can work with data feeds to process and correlate events and identify anomalies. The intelligence framework requires a feed to match and create alerts from the network traffic. Let’s demonstrate a single user-generated threat intel file and let Zeek use it as the primary intelligence source.
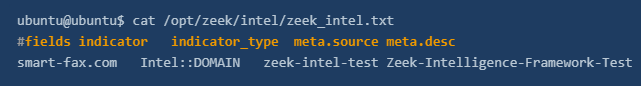
- Intelligence source location:
/opt/zeek/intel/zeek_intel.txt
Critical Points:
- First, the source file has to be
tab-delimited. - Second, you can manually update the source and adding extra lines doesn’t require any re-deployment. However, if you delete a line from the file, you will need to re-deploy the Zeek instance.
(1) Adding the suspicious URL gathered from the case1.pcap file as a source intel
Checking what's inside the threat intel text file:
1
$ cat /opt/zeek/intel/zeek_intel.txt
1
- There is one intelligence input, and it is focused on a domain name, so when this domain name appears in the network traffic, Zeek will create the "intel.log" file and provide the available details.
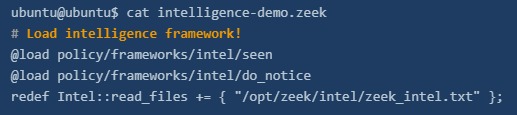
Checking the Zeek script we will use in this exercise:
1
$ cat intelligence-demo.zeek
Investigating intel file and script
Command executed:
1
$ zeek -C -r case1.pcap intelligence-demo.zeek
1
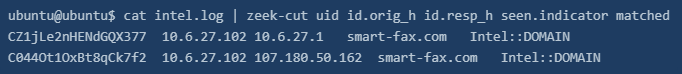
$ cat intel.log | zeek-cut uid id.orig_h id.resp_h seen.indicator matched
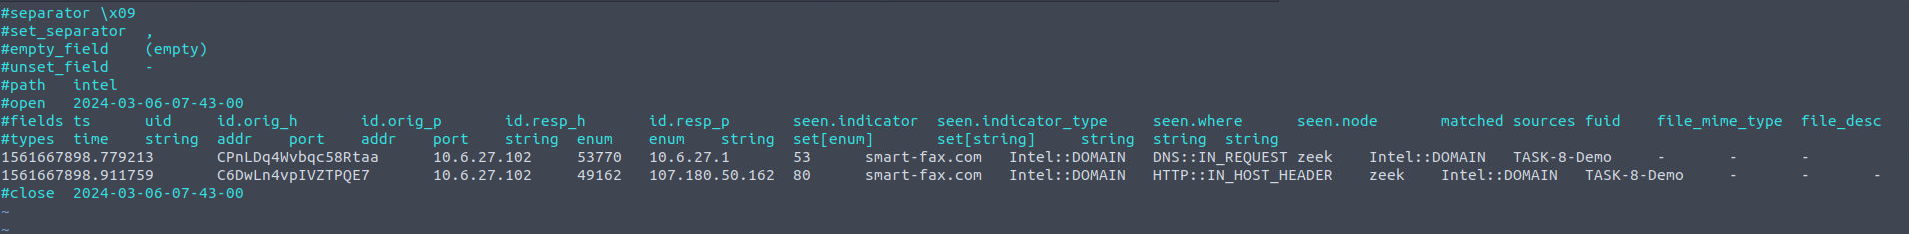
Output:
- Investigate the case1.pcap file with
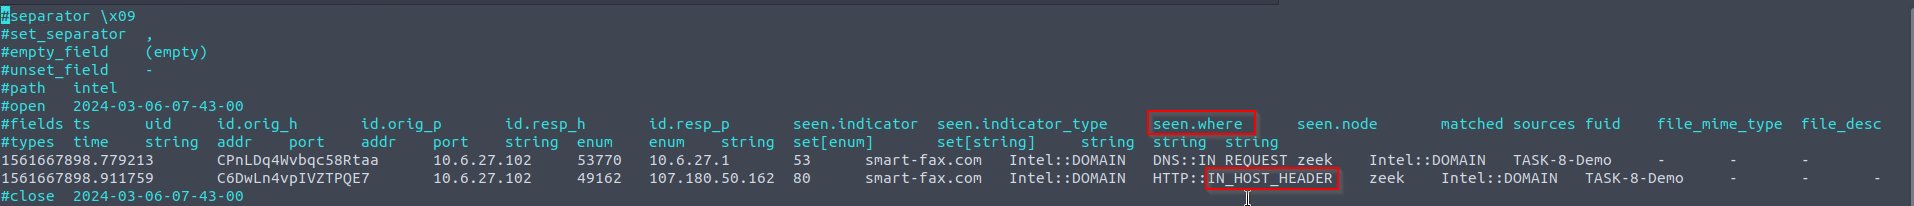
intelligence-demo.zeekscript. Investigate the intel.log file. Look at the second finding, where was the intel info found?
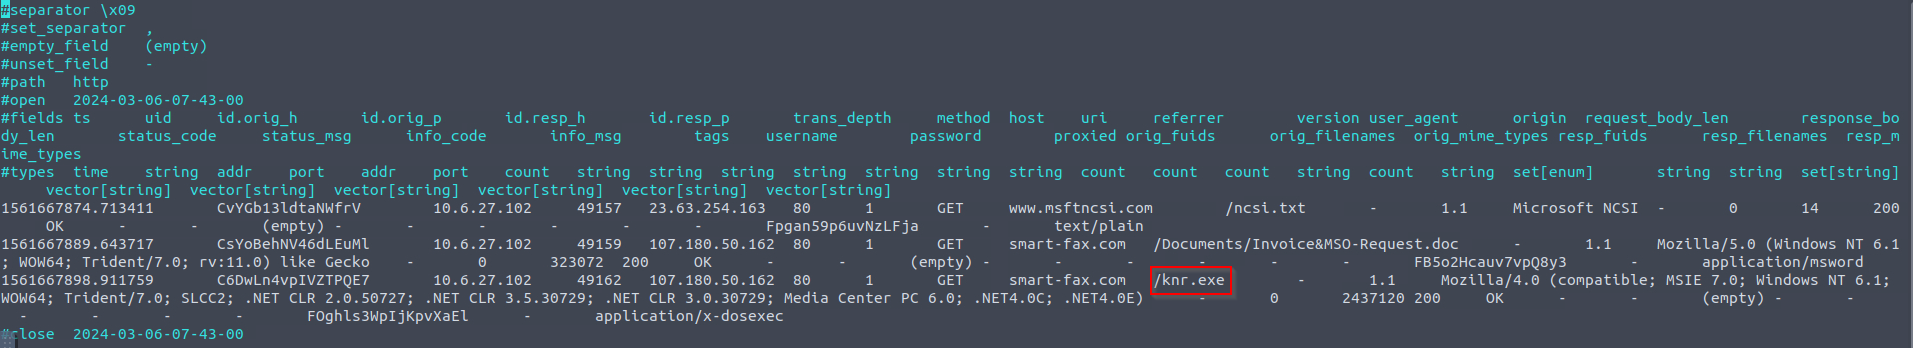
- Investigate the
http.logfile. What is the name of the downloaded.exefile?
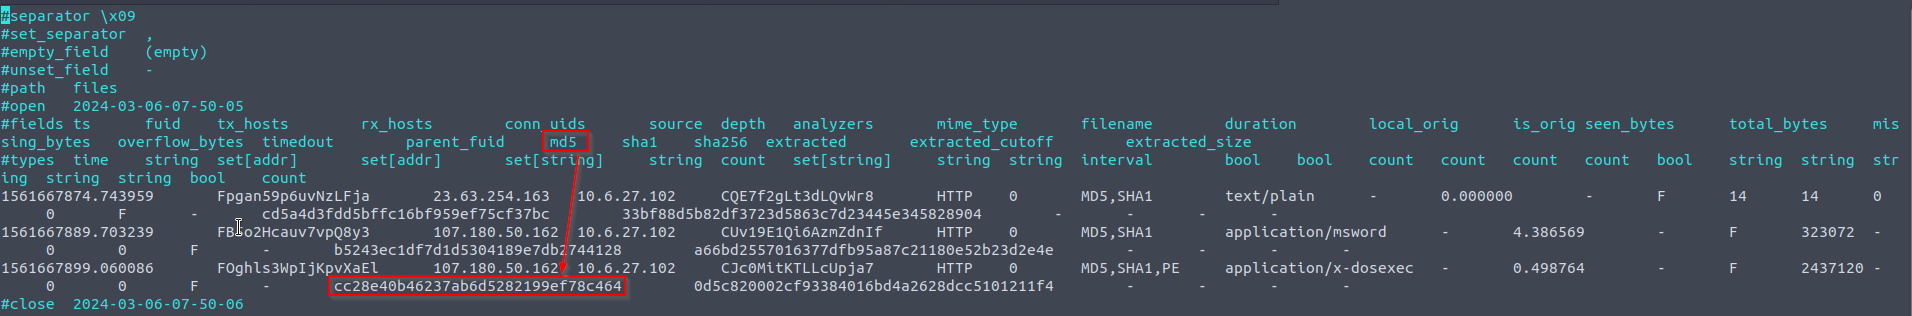
- Investigate the
case1.pcapfile withhash-demo.zeekscript. Investigate thefiles.logfile. What is the MD5 hash of the downloaded.exefile?
Command executed:
1
$ zeek -C -r case1.pcap hash-demo.zeek
- Investigate the
case1.pcapfile withfile-extract-demo.zeekscript. Investigate the ”extract_files“ folder. Review the contents of the text file. What is written in the file?
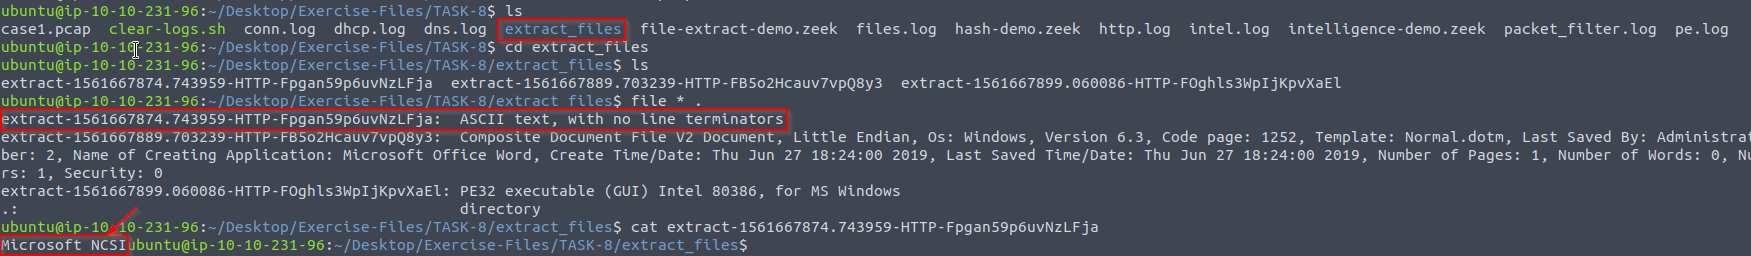
1
- Microsoft NCSI
Zeek Scripts: Packages
Scripts 204: Package Manager
Zeek Package Manager helps users install third-party scripts and plugins to extend Zeek functionalities with ease. The package manager is installed with Zeek and available with the
zkgcommand.Users can install, load, remove, update and create packages with the “
zkg” tool. You can read more on and view available packages here and here. Please note that you need root privileges to use the “zkg” tool.
Basic usage of zkg:
1
2
3
4
5
6
- "zkg install package_path" : Install a package. Example (zkg install zeek/j-gras/zeek-af_packet-plugin).
- "zkg install git_url" : Install package. Example (zkg install https://github.com/corelight/ztest).
- "zkg list" : List installed package.
- "zkg remove" : Remove installed package.
- "zkg refresh" : Check version updates for installed packages.
- "zkg upgrade" : Update installed packages.
Approaches to using packages:
1
2
3
1. Using them as frameworks and calling specific package path/directory per usage
2. Calling packages from a script with the "@load" method
3. Calling their package names; note that this method works only for packages installed with the "zkg" install method
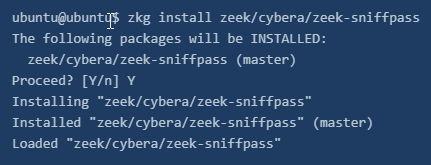
Packages: Cleartext Submission of Password
1. Let’s install a package first and then demonstrate the usage in different approaches.
Note: The package is installed in the given VM.
Command:
1
$ zkg install zeek/cybera/zeek-sniffpass
Output:
Command:
1
$ zkg list
Output:

How to execute/load packages against a pcap
Using the package in three ways:
1
2
3
4
5
6
7
8
9
10
11
12
1. Calling with script:
$ zeek -Cr http.pcap sniff-demo.zeek

-> View script contents:
$ cat sniff-demo.zeek
@load /opt/zeek/share/zeek/site/zeek-sniffpass

2. Calling from path:
$ zeek -Cr http.pcap /opt/zeek/share/zeek/site/zeek-sniffpass

3. Calling with package name:
$ zeek -Cr http.pcap zeek-sniffpass
1
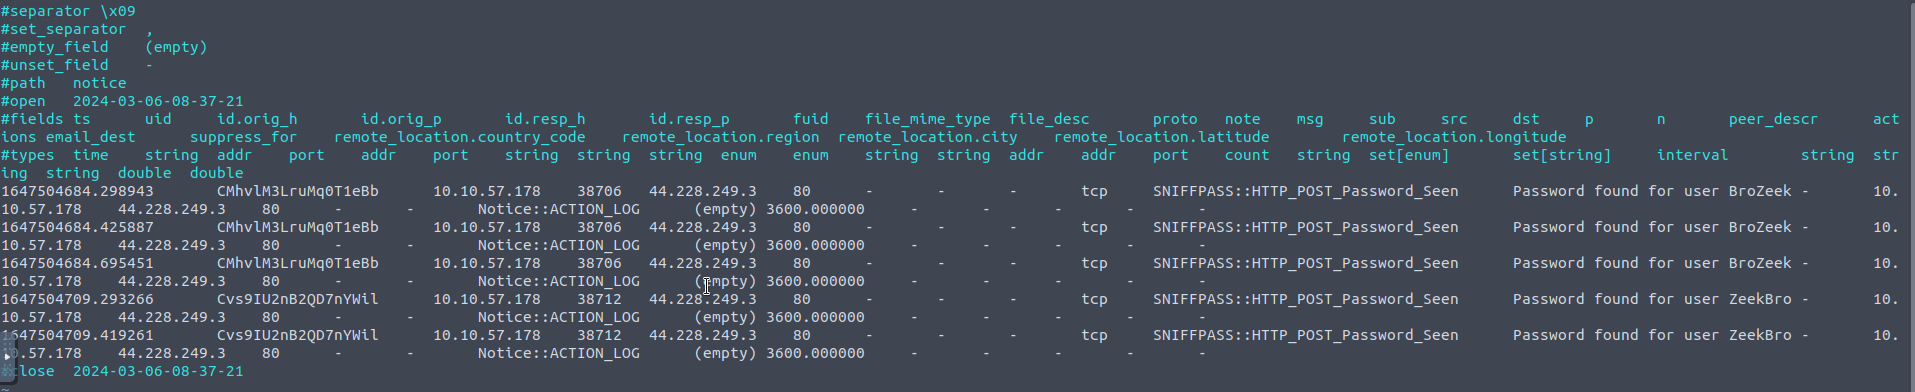
- The "zeek-sniffpass" package provides additional information in the notice.log file
Investigating the log file:
1
$ cat notice.log | zeek-cut id.orig_h id.resp_h proto note msg

1
- The package found cleartext password submissions, provided notice, and grabbed the usernames
Packages: Geolocation Data
- Let’s use another helpful package called “
geoip-conn”. - This package provides geolocation information for the IP addresses in the
conn.logfile. - It depends on “
GeoLite2-City.mmdb” database created by MaxMind. - This package provides location information for only matched IP addresses from the internal database.
1
$ zeek -Cr case1.pcap geoip-conn
Questions and Answers section:
- Investigate the
http.pcapfile with thezeek-sniffpassmodule. Investigate thenotice.logfile. Which username has more module hits? Command:1
$ zeek -Cr http.pcap zeek-sniffpass
Log files generated:

-> notice.log:
- Investigate the
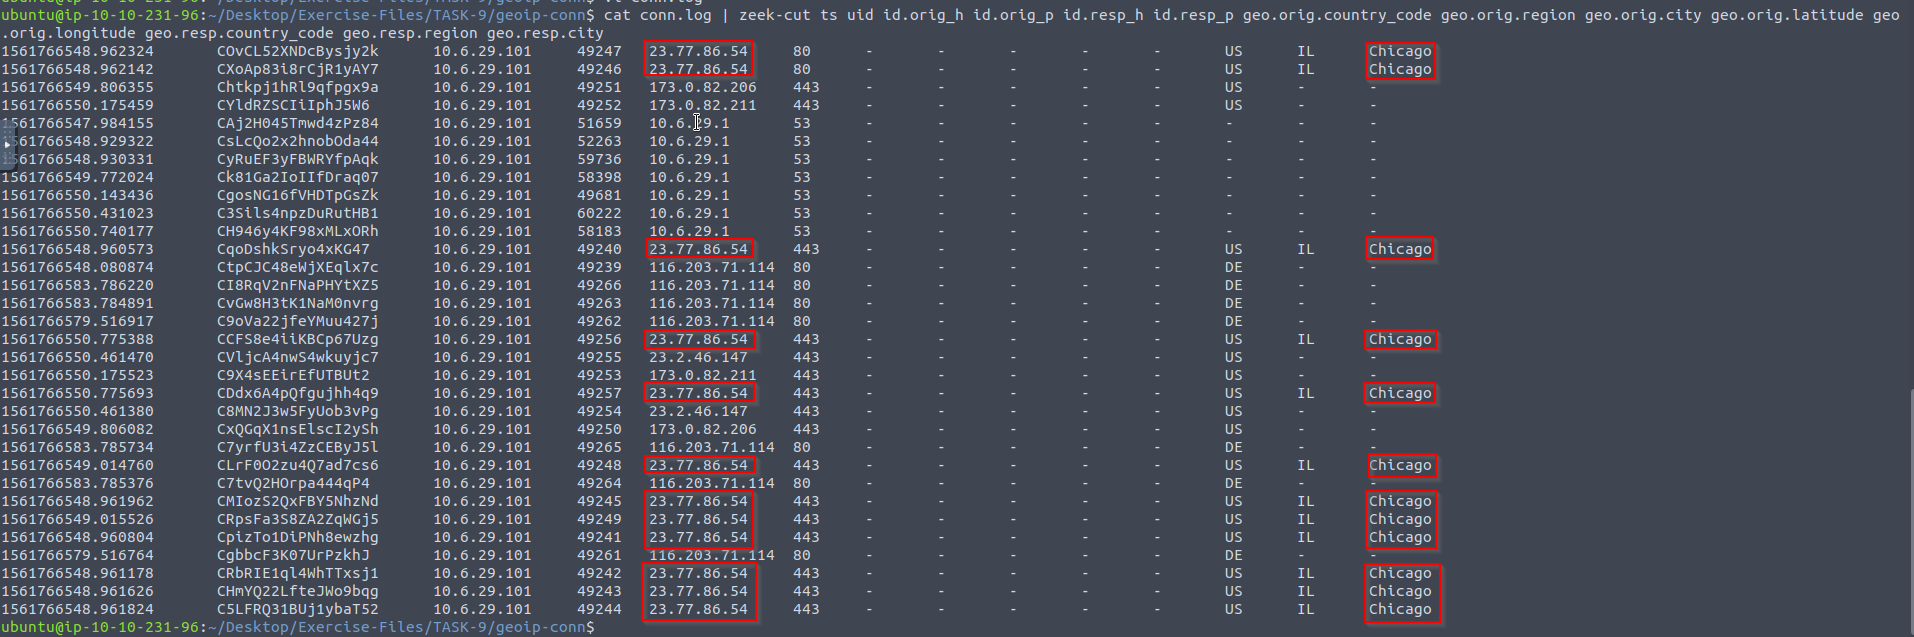
case2.pcapfile withgeoip-connmodule. Investigate theconn.logfile. What is the name of the identified City? Command:
1
$ zeek -Cr case2.pcap geoip-conn

-> conn.log:
1
$ cat conn.log | zeek-cut ts uid id.orig_h id.orig_p id.resp_h id.resp_p geo.orig.country_code geo.orig.region geo.orig.city geo.orig.latitude geo.orig.longitude geo.resp.country_code geo.resp.region geo.resp.city
Output:
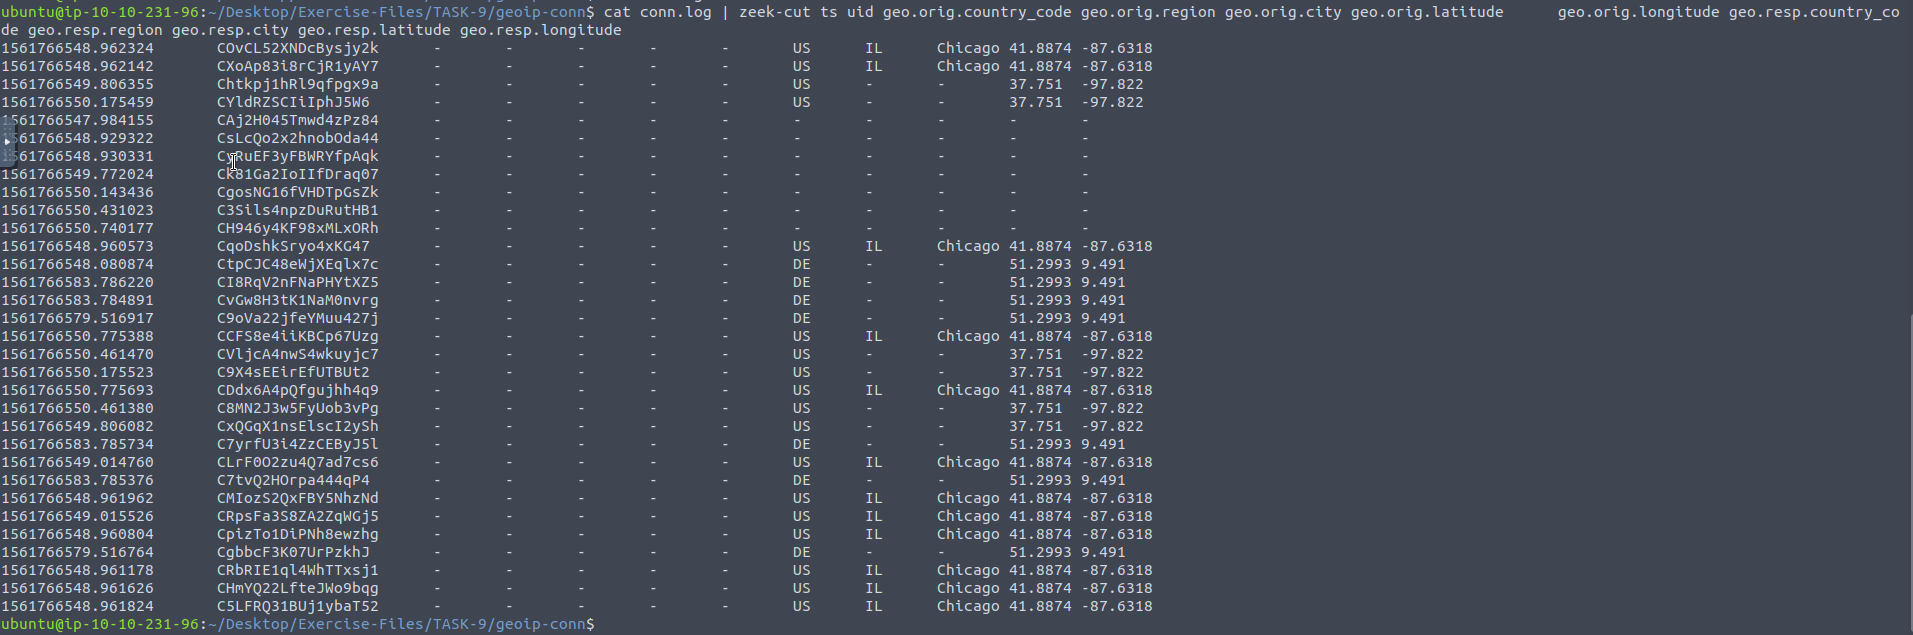
- Which IP address is associated with the identified City?
23.77.86.54
- Investigate the
case2.pcapfile withsumstats-counttable.zeekscript. How many types of status codes are there in the given traffic capture?
Command:
1
$ zeek -Cr case2.pcap sumstats-counttable.zeek
Output:
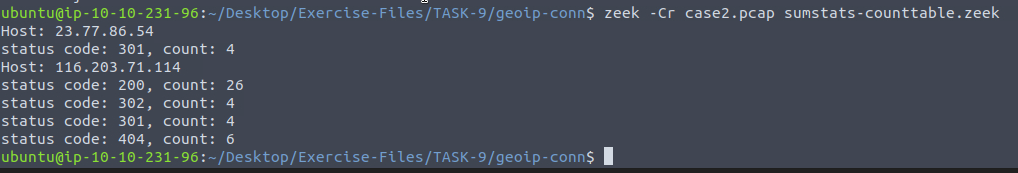
-> sumstats-counttable.zeek:
1
2
3
4
5
6
7
8
9
10
11
12
13
14
15
16
17
18
19
20
21
22
23
24
25
26
27
28
29
30
31
32
33
34
35
36
37
38
39
40
41
42
43
44
45
46
47
48
49
@load /opt/zeek/share/zeek/site/packages/zeek-sumstats-counttable

event zeek_init()
{
	local r1 = SumStats::Reducer($stream="status.code", $apply=set(SumStats::COUNTTABLE));
	SumStats::create([$name="http-status-codes",
		$epoch=1hr, $reducers=set(r1),
		$epoch_result(ts: time, key: SumStats::Key, result: SumStats::Result) =
		{
			local r = result["status.code"];
			# abort if we have no results
			if ( ! r?$counttable )
				return;

			local counttable = r$counttable;
			print fmt("Host: %s", key$host);
			for ( i in counttable )
				print fmt("status code: %s, count: %d", i, counttable[i]);
		}]);
}

event http_reply(c: connection, version: string, code: count, reason: string)
{
	SumStats::observe("status.code", [$host=c$id$resp_h], [$str=cat(code), $num=1]);
}@load packages/zeek-sumstats-counttable

event zeek_init()
	{
	local r1 = SumStats::Reducer($stream="status.code", $apply=set(SumStats::COUNTTABLE));
	SumStats::create([$name="http-status-codes",
		$epoch=1hr, $reducers=set(r1),
		$epoch_result(ts: time, key: SumStats::Key, result: SumStats::Result) =
		{
			local r = result["status.code"];
			# abort if we have no results
			if ( ! r?$counttable )
				return;

			local counttable = r$counttable;
			print fmt("Host: %s", key$host);
			for ( i in counttable )
				print fmt("status code: %s, count: %d", i, counttable[i]);
		}]);
	}

event http_reply(c: connection, version: string, code: count, reason: string)
{
	SumStats::observe("status.code", [$host=c$id$resp_h], [$str=cat(code), $num=1]);
}