Intro
A few weeks ago, Jasmine, the owner of Coffely, had reported a potential data breach resulting in her secret recipe getting stolen by James from the IT department. Before the recipe could get into the hands of the competitors, he was apprehended after finding undeniable evidence in his laptop, thanks to our Forensics team’s quick investigation.
Now, Jasmine wants to develop an in-house SOC capability for continuously monitoring the critical logs and events to keep an eye on all the activities within the network. She has contacted our team to provide an on-prem resource who can set up a SIEM locally and ingest necessary logs from the different log sources.
Our choice of SIEM is Splunk for this activity. You are tasked with installing and configuring Splunk and integrating the log sources on Linux and Windows OS.
About the Lab
In this room, you will be handed over two VMs, Linux and Windows, and your task will be to install Splunk on both Machines and integrate important log sources on each server either through listening ports or by installing forwarders.
Learning Objectives
This room covers the following learning objectives:
1
2
3
- Dive deep into the Splunk installation process.
- How to install and configure Splunk in Linux and Windows Environments.
- How to integrate different log sources into Splunk.
Splunk: Setting up a Lab
Linux Lab
1
2
3
- Install Splunk on Ubuntu Server
- Install and integrate Universal Forwarder
- Collecting Logs from important logs sources/files like syslog, auth.log, audited, etc
Windows Lab
1
2
3
4
- Install Splunk on Windows Machine
- Install and Integrate the Universal Forwarder
- Integrating and monitoring Coffely.THM's weblogs
- Integrating Windows Event Logs
Splunk deployment on Linux Server
Splunk supports all major OS versions, has very straightforward steps to install, and can be up and running in less than 10 minutes on any platform. In this task, we will only focus on installing Splunk Enterprise on the Linux host. Typically, we would create an account on [splunk.com](https://www.splunk.com/) and go to this Splunk Enterprise download link to select the installation package for the latest version. As of the time of writing, 9.0.3 is the newest version available on its website.
Note: Users are not expected to create an account and download the Splunk Enterprise during this activity. All required executables are already downloaded in relevant paths.
Connect with the Lab
For the sake of simplicity, the Splunk installer is already downloaded at the location ~/Downloads/splunk:
1
2
ubuntu@coffely:~/Downloads/splunk/$ ls
splunk_installer.tgz splunkforwarder.tgz
Note: Make sure, to run sudo su to change to the root user before applying commands.
1
2
ubuntu@coffely:~/Downloads/splunk/$ sudo su
root@coffely:~/Downloads/splunk/#
Splunk Installation
Splunk installation is as simple as running a command. You will need to uncompress Splunk by running the following command.
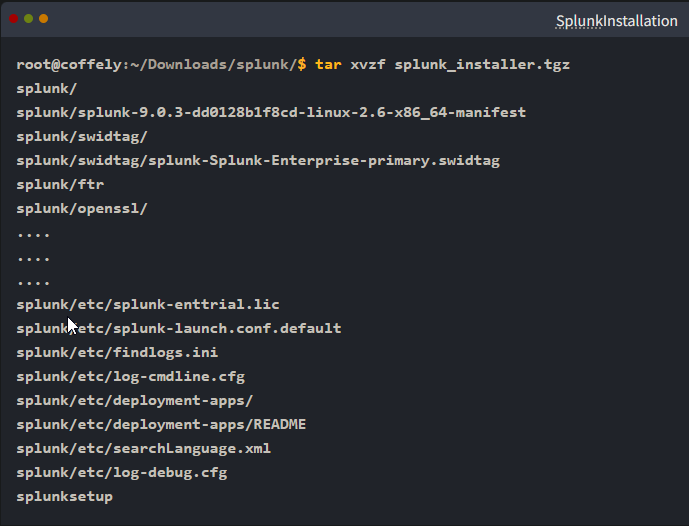
After the installation is complete, a new folder named splunk will be created, as shown below. Let’s now move this folder to the /opt/ directory and start working on Splunk from there.
1
2
3
4
root@coffely:~/Downloads/splunk/$ ls splunk
splunk_installer.tgz splunkforwarder.tgz
root@coffely:~/Downloads/splunk/$ mv splunk /opt/
root@coffely:~/Downloads/splunk/$ mv splunkforwarder /opt/
Starting Splunk
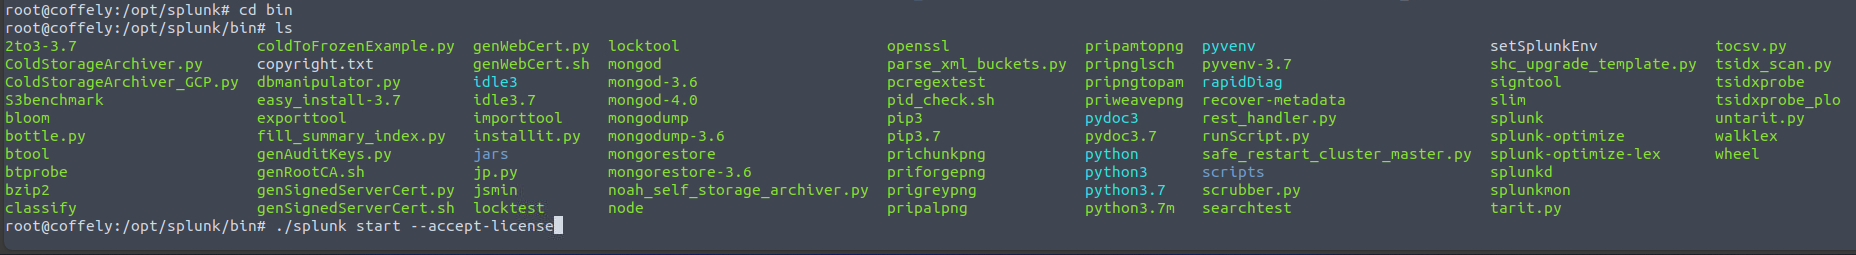
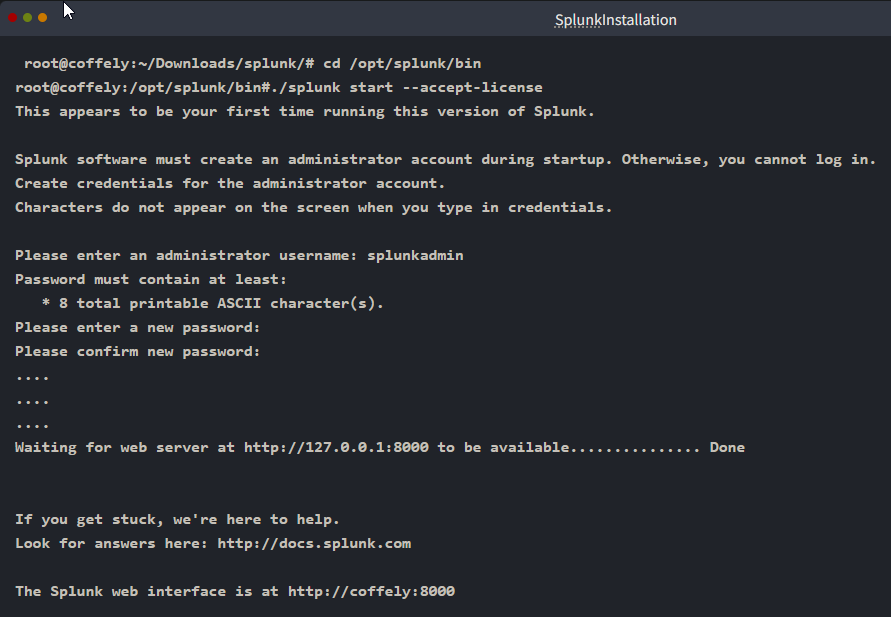
The above step unzips the Splunk installer and installs all the necessary binaries and files on the system. Once installed, go to the directory /opt/splunk/bin and run the following command to start Splunk:
1
./splunk start --accept-license
As it is the first time we are starting the Splunk instance, it will ask the user for admin credentials. Create a user account and proceed.
Accessing Splunk
Congrats! - We successfully installed Splunk on our Linux machine, which took us less than 10 minutes. To access Splunk, open the browser within the VM and go to the address http://coffely:8000. If you are connected to the VPN, you can access Splunk right in your browser by going to the address:
1
http://coffely:8000
Use the credentials you created during the installation to access the Splunk dashboard. 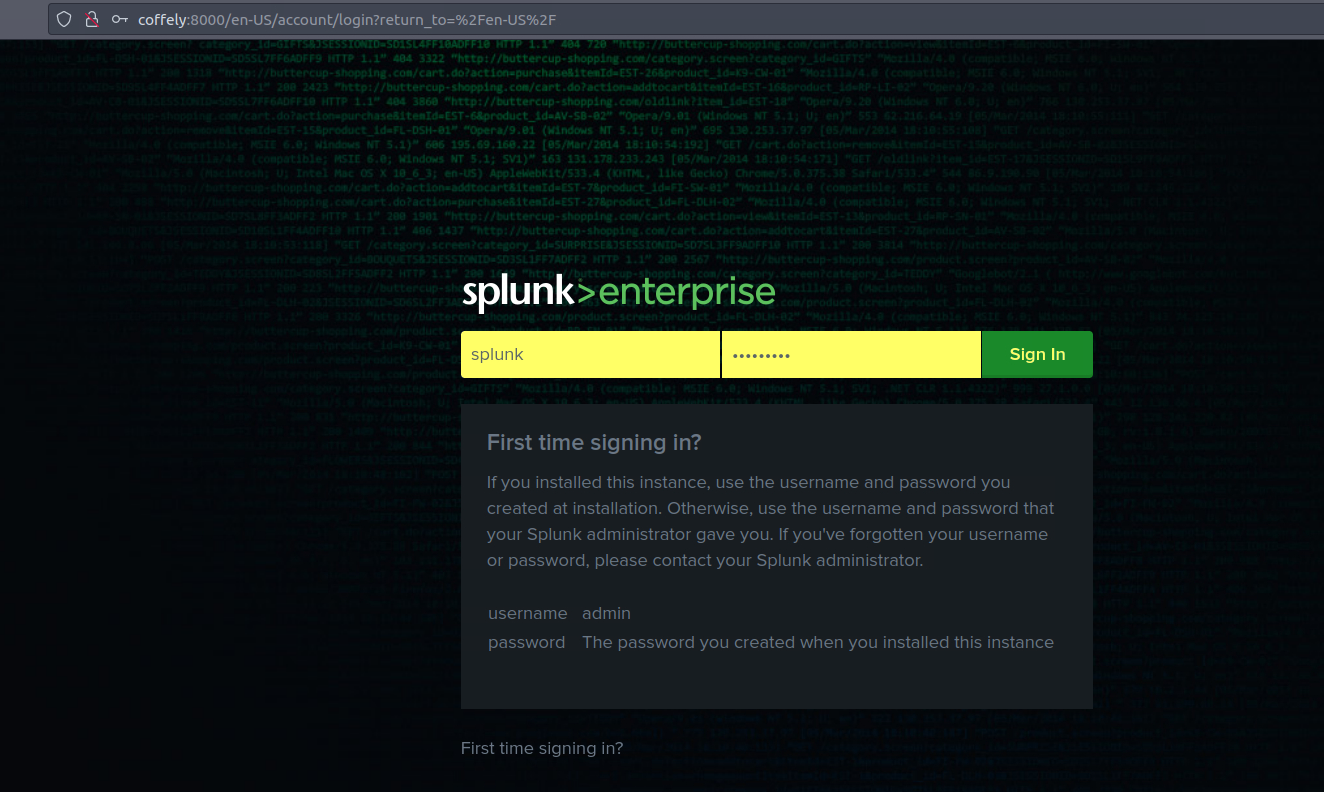
Explore the different Splunk apps on the left panel. We will explore them further in the coming tasks.
Splunk : Interacting with CLI
Now that we have installed Splunk, it’s important to learn some key commands while interacting with Splunk instances through CLI. These commands are run from the /opt/splunk/ directory. It is important to note that we can use the same commands on different platforms.
Some important and commonly used commands are shown below:
Command 1:
1
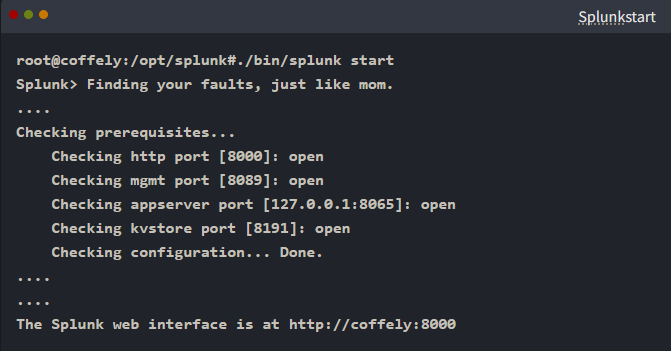
splunk start
The splunk start command is used to start the Splunk server. This command starts all the necessary Splunk processes and enables the server to accept incoming data. If the server is already running, this command will have no effect.
1
As mentioned in the output, the Splunk dashboard will be accessible within the VM at `HTTP://coffely:8000`
Command 2:
1
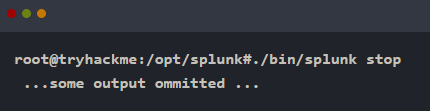
splunk stop
The splunk stop command is used to stop the Splunk server. This command stops all the running Splunk processes and disables the server from accepting incoming data. If the server is not running, this command will have no effect.
Command 3:
1
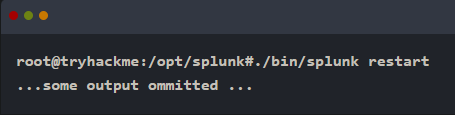
splunk restart
The splunk restart command is used to restart the Splunk server. This command stops all the running Splunk processes and then starts them again. This is useful when changes have been made to the Splunk configuration files or when the server needs to be restarted for any other reason.
Command 4:
1
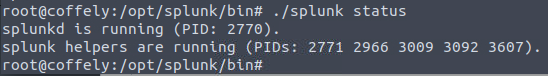
splunk status
The splunk status command is used to check the status of the Splunk server. This command will display information about the current state of the server, including whether it is running or not, and any errors that may be occurring.
Command 5:
1
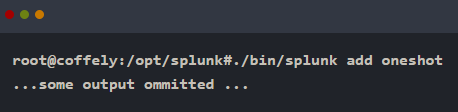
splunk add oneshot
The splunk add oneshot command is used to add a single event to the Splunk index. This is useful for testing purposes or for adding individual events that may not be part of a larger data stream.
Command 6:
1
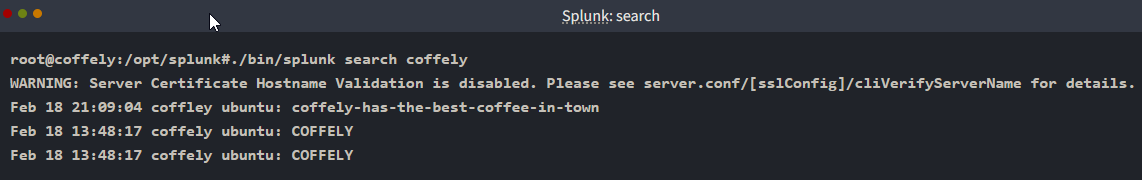
splunk search
The splunk search command is used to search for data in the Splunk index. This command can be used to search for specific events, as well as to perform more complex searches using Splunk’s search language.
Command 7:
1
splunk help
The most important command is the help command which provides all the help options.
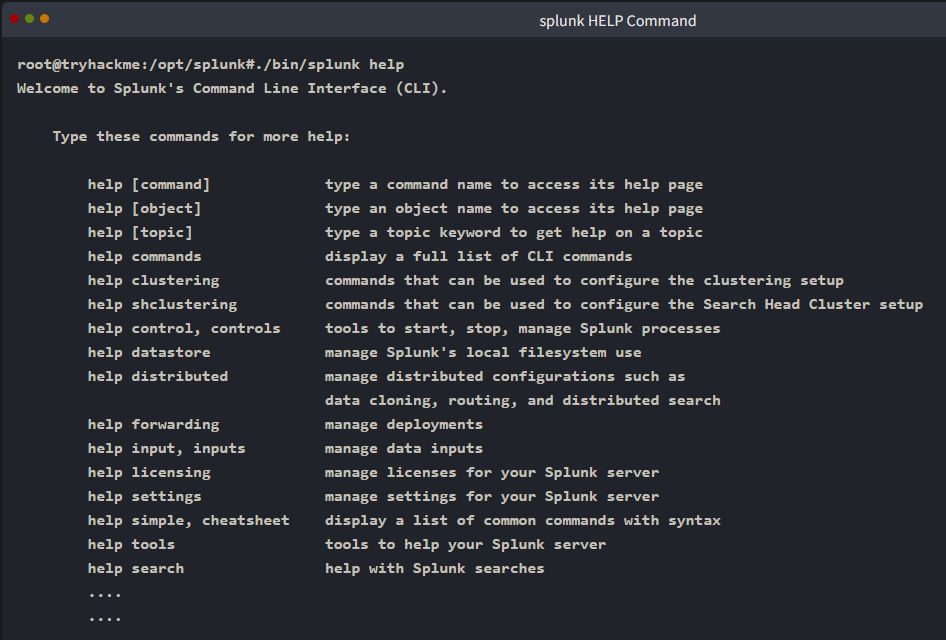
1
- These are just a few of the many CLI commands available in Splunk. Administrators can use the CLI to manage and configure their Splunk servers more efficiently and effectively.
- In Splunk, what is the command to search for the term coffely in the logs?
1
./bin/splunk search coffely
Splunk : Data Ingestion
Configuring data ingestion is an important part of Splunk. This allows for the data to be indexed and searchable for the analysts. Splunk accepts data from various log sources like Operating System logs, Web Applications, Intrusion Detection logs, Osquery logs, etc. In this task, we will use Splunk Forwarder to ingest the Linux logs into our Splunk instance.
Splunk Forwarders
Splunk has two primary types of forwarders that can be used in different use cases. They are explained below:
(1) Heavy Forwarders
Heavy forwarders are used when we need to apply a filter, analyze or make changes to the logs at the source BEFORE forwarding it to the destination. In this task, we will be installing and configuring Universal forwarders.
(2) Universal Forwarders
It is a lightweight agent that gets installed on the target host, and its main purpose is to get the logs and send them to the Splunk instance or another forwarder WITHOUT applying any filters or indexing. It has to be downloaded separately and has to be enabled before use. In our case, we will use a universal forwarder to ingest logs.
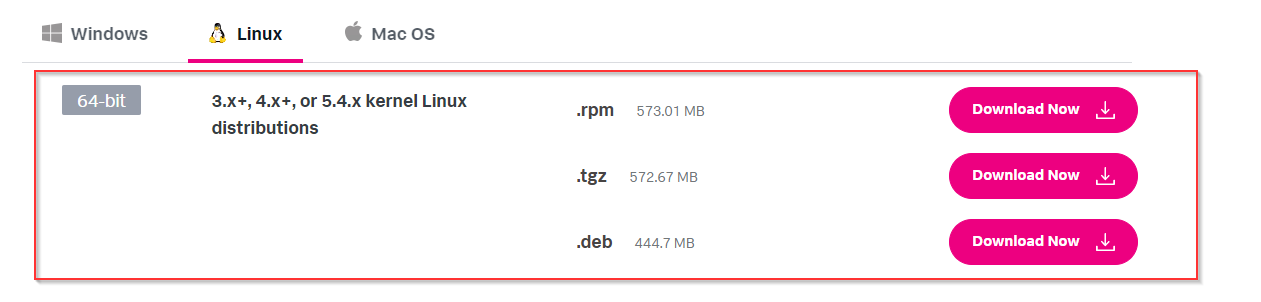
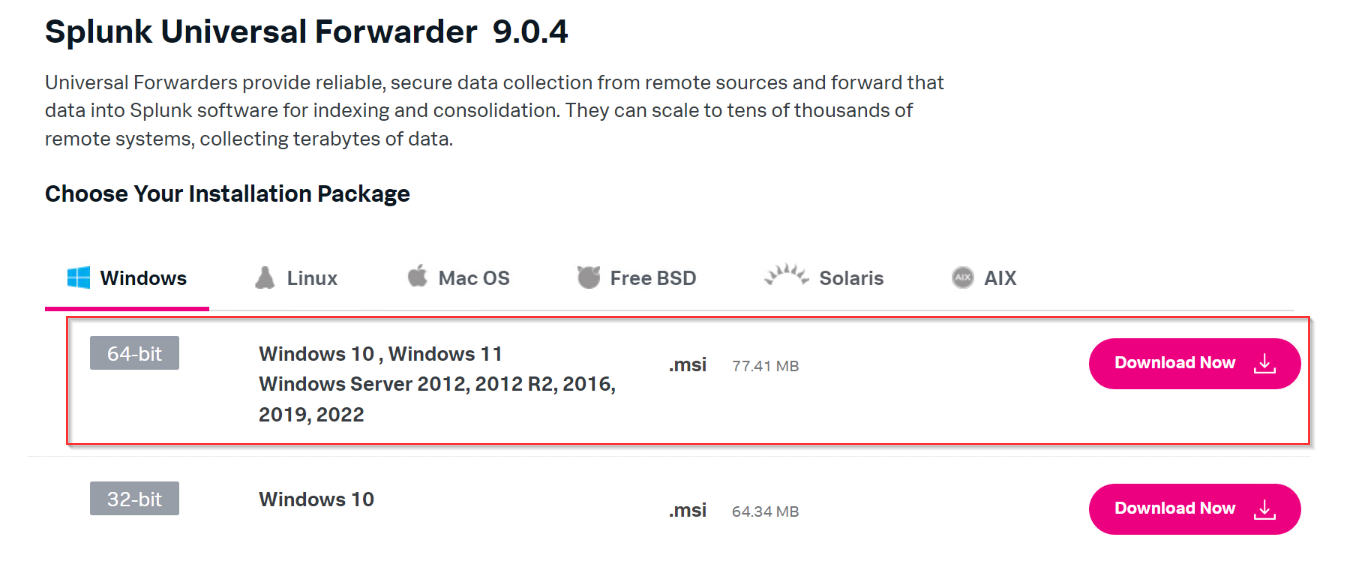
Universal forwarders can be downloaded from the official Splunk website. It supports various OS, as shown below:
Note: As of writing this, 9.0.3 is the latest version available on the Splunk site.
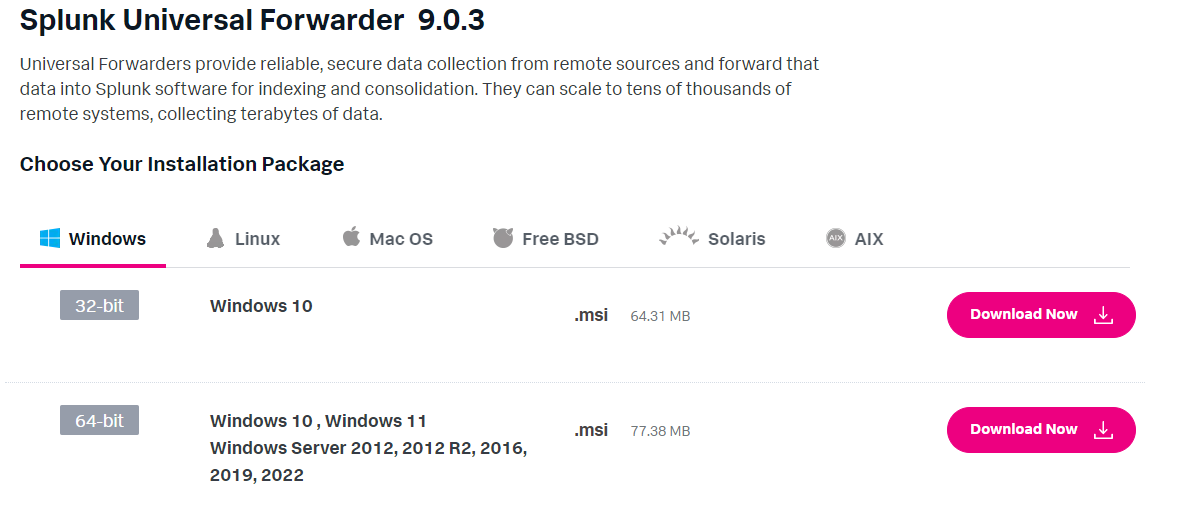
For this task, the 64-bit version of Linux Forwarder is already downloaded in the folder ~/Downloads/splunk.
Splunk Forwarder:
1
2
ubuntu@coffely:~/Downloads/splunk# ls
splunk_installer.tgz splunkforwarder.tgz
Install Forwarder
1. Change the user to sudo, unpack, and install the forwarder with the following command: 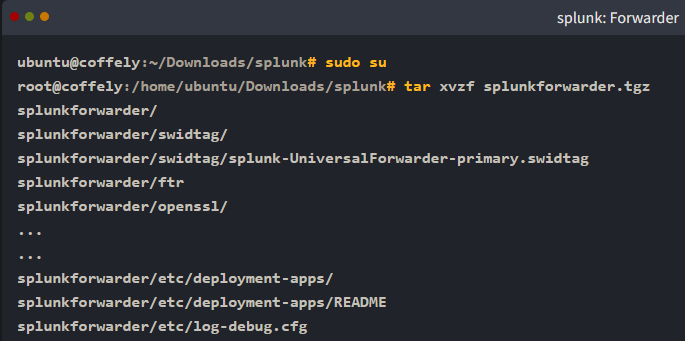
2. The above command will install all required files in the folder splunkforwarder. Next, we will move this folder to /opt/ path with the command:
1
mv splunkforwarder /opt/
3. We will run the Splunk forwarder instance now and provide it with the new credentials as shown below:
1
./bin/splunk start --accept-license
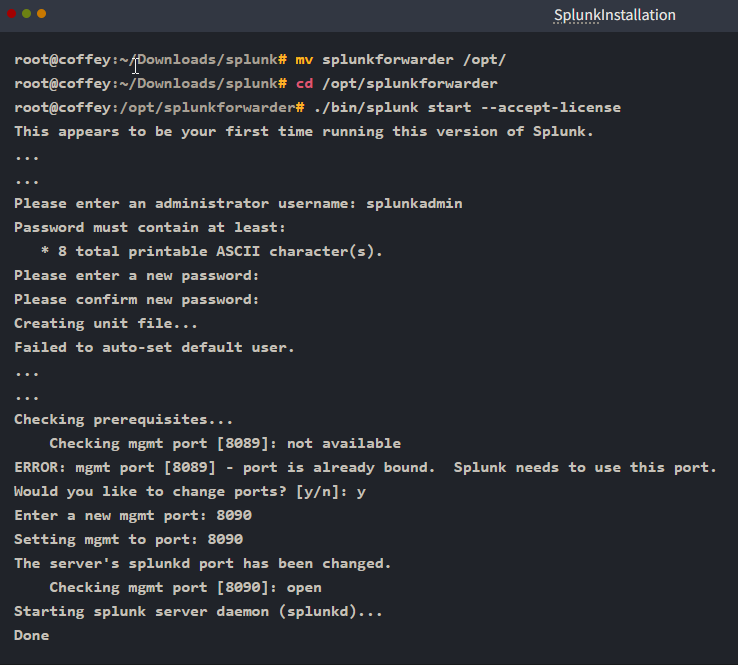
By default, Splunk forwarder runs on port 8089. If the system finds the port unavailable, it will ask the user for the custom port. In this example, we are using 8090 for the forwarder.
Splunk Forwarder is up and running but does not know what data to send and where. This is what we are going to configure next.
- What is the default port, on which Splunk Forwarder runs on?
1
8089
Configuring Forwarder on Linux
Now that we have installed the forwarder, it needs to know WHERE to send the data. So we will configure it on the host end to send the data and configure Splunk so that it knows from where it is receiving the data.
Splunk Configuration
4. Log into Splunk and Go to Settings -> Forward and receiving tab as shown below: 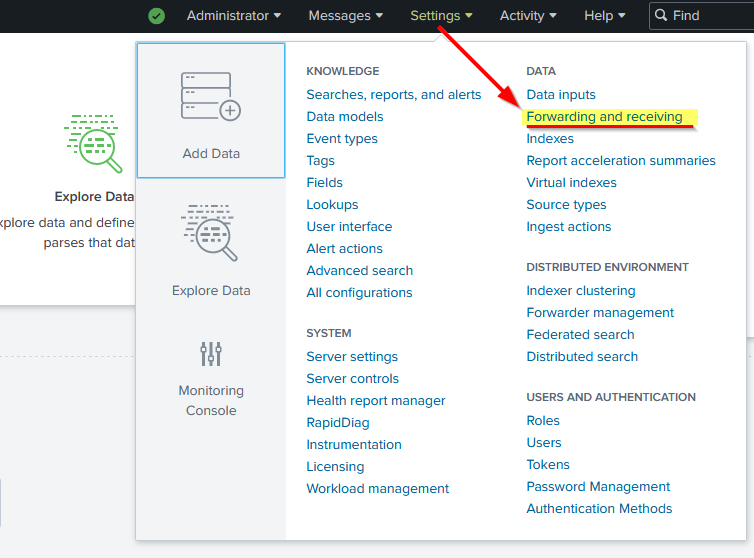
5. It will show multiple options to configure both forwarding and receiving. As we want to receive data from the Linux endpoint, we will click on Configure receiving and then proceed by configuring a new receiving port: 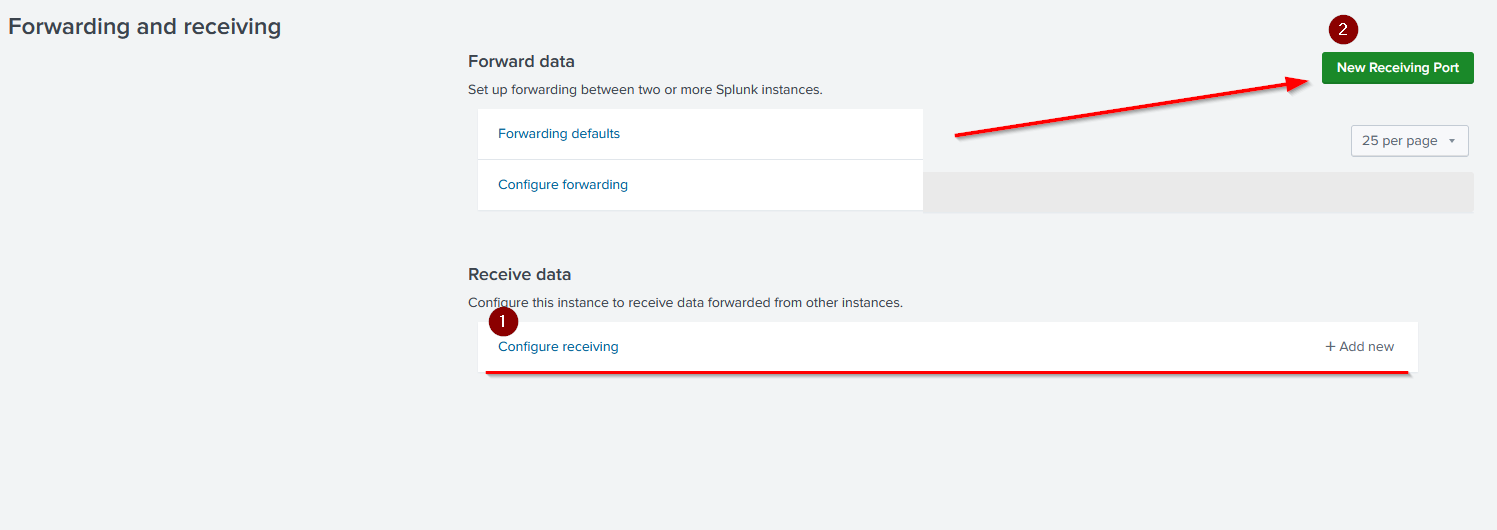
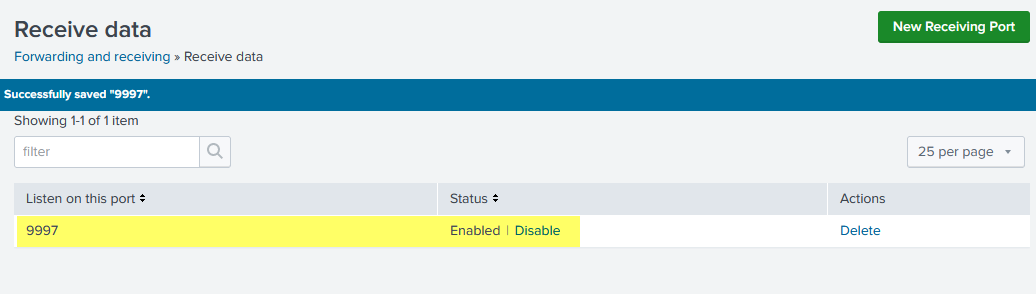
6. Our listening port 9997 is now enabled and waiting for the data. If we want, we can delete this entry by clicking on the Delete option under the Actions column.
Creating Index
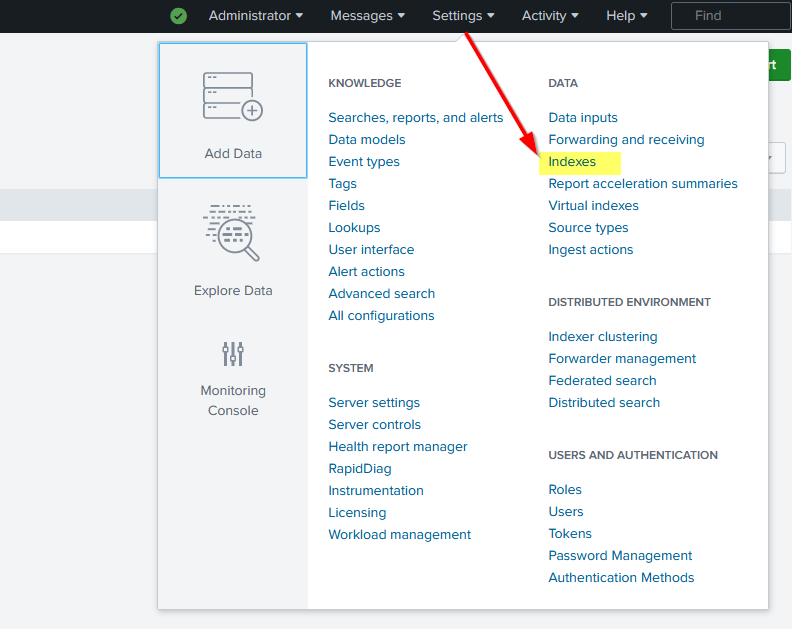
7. Now that we have enabled a listening port, the important next step is to create an index that will store all the receiving data.
If we do not specify an index, it will start storing received data in the default index, which is called the
mainindex.![]()
- The indexes tab contains all the indexes created by the user or by default. This shows some important
metadataabout the indexes like: ```c - Size,
- Event Count,
- Home Path,
- Status,
- etc. ```
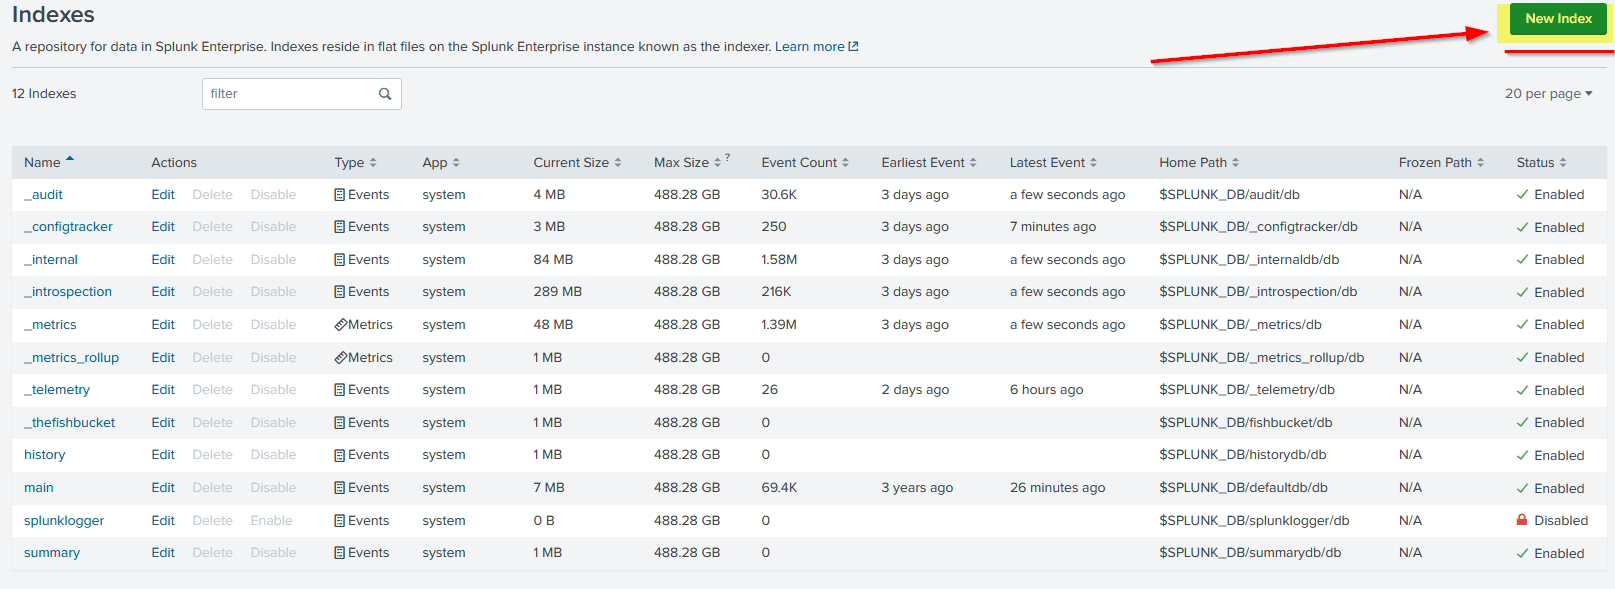
8. Click the New Index button, fill out the form, and click Save to create the index. Here we have created an index called Linux_host as shown below: 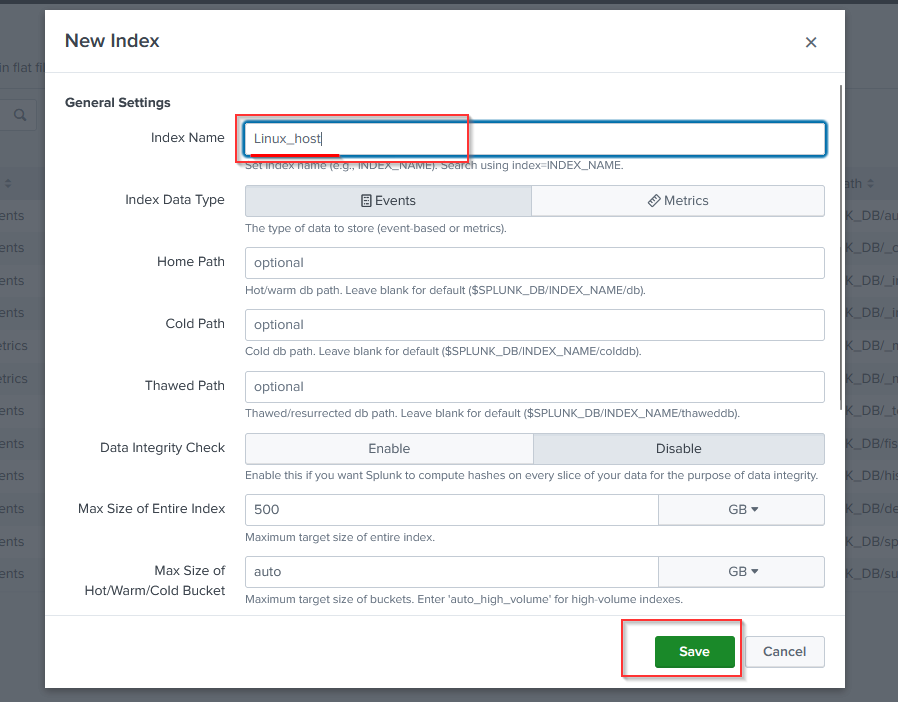
Configuring Forwarder
9. It’s time to configure the forwarder to ensure it sends the data to the right destination. Back in the Linux host terminal, go to the /opt/splunkforwarder/bin directory:
1
2
3
4
5
root@coffely:/opt/splunkforwarder/bin# ./splunk add forward-server 10.10.222.234:9997
WARNING: Server Certificate Hostname Validation is disabled. Please see server.conf/[sslConfig]/cliVerifyServerName for details.
Splunk username: splunkadmin
Password:
Added forwarding to: 10.10.222.234:9997.
1
- This command will add the forwarder server, which listens to port 9997.
Output: 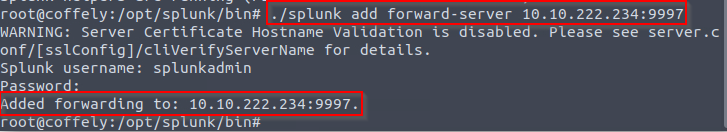
Linux Log Sources
Linux stores all its important logs into the /var/log file, as shown below. In our case, we will ingest syslog into Splunk. All other logs can be ingested using the same method: 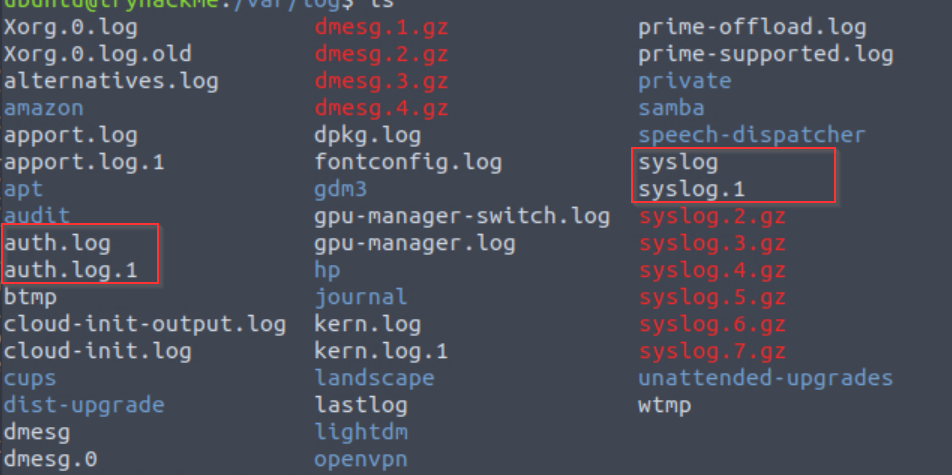
10. Next, we will tell Splunk forwarder which logs files to monitor. Here, we tell Splunk Forwarder to monitor the /var/log/syslog file.
Ingest syslog file:
1
2
3
root@coffely:/opt/splunkforwarder/bin# ./splunk add monitor /var/log/syslog -index Linux_host
WARNING: Server Certificate Hostname Validation is disabled. Please see server.conf/[sslConfig]/cliVerifyServerName for details.
Added monitor of '/var/log/syslog'.
Exploring Inputs.conf
11. We can also open the inputs.conf file located in /opt/splunkforwarder/etc/apps/search/local, and look at the configuration added after the commands we used above:
1
2
root@coffely:/opt/splunkforwarder/etc/apps/search/local# ls
inputs.conf
1
- We can view the content of the `input.conf` using the cat command.
Example content of inputs.conf:
1
2
3
4
root@coffely:/opt/splunkforwarder/etc/apps/search/local# cat inputs.conf
[monitor:///var/log/syslog]
disabled = false
index = Linux_host
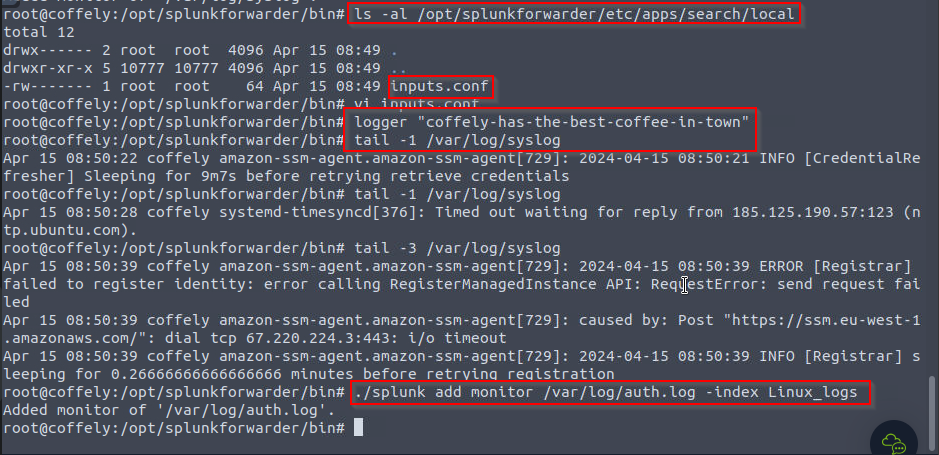
Utilizing Logger Utility
- Logger is a built-in command line tool to
create test logsadded to thesyslogfile.
12. As we are already monitoring the syslog file and sending all logs to the Splunk, the log we generate in the next step can be found with Splunk logs.
- To run the command, use the following command:
1
2
tryhackme@coffely:/opt/splunkforwarder/bin# logger "coffely-has-the-best-coffee-in-town"
tryhackme@coffely:/tryhackme@coffleylab:/opt/splunkforwarder/bin# tail -1 /var/log/syslog // testing in terminal
Testing in the web application: 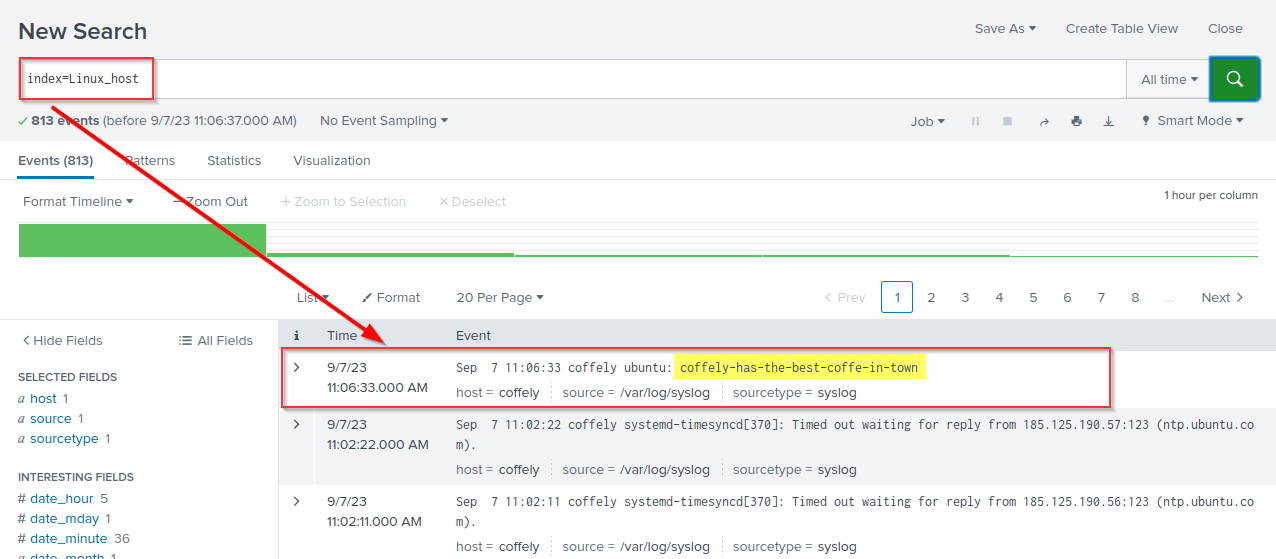
1
- Great, We have successfully installed and configured Splunk Forwarder to get the logs fom the syslog file into Splunk.
Question and Answers section:
- Follow the same steps and ingest
/var/log/auth.logfile into Splunk indexLinux_logs. What is the value in thesourcetypefield?![]()
Output: 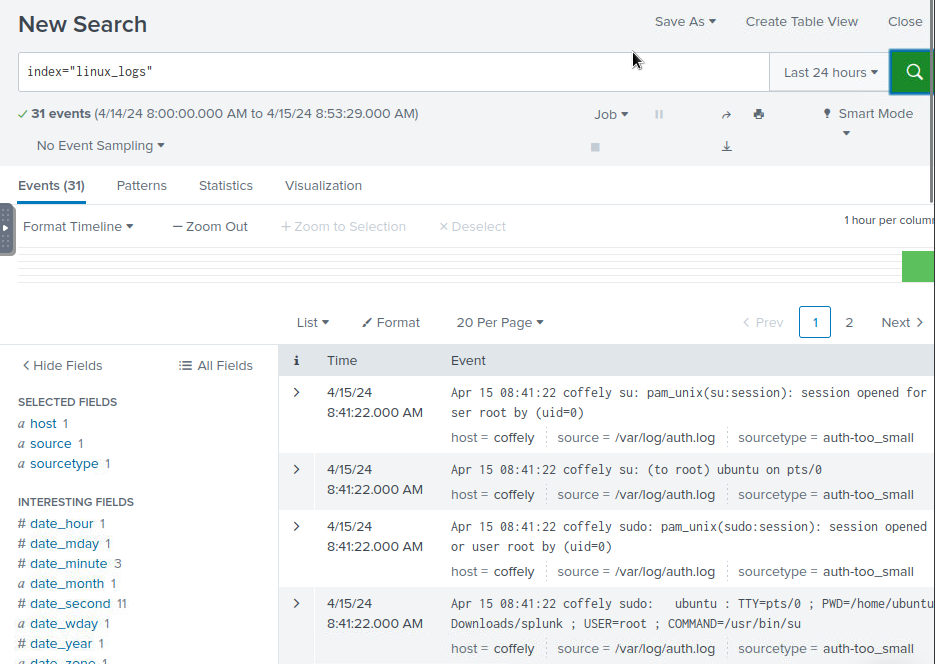
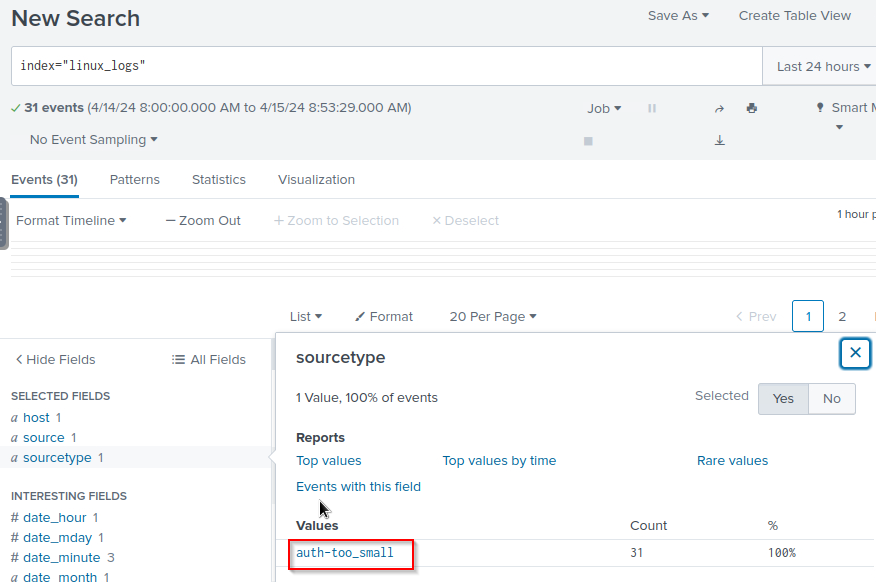
1
- You have to generate more than 100 events on "Linux_logs" index specifically on the 'auth.log' that we are monitoring on before you can actually see the source type.
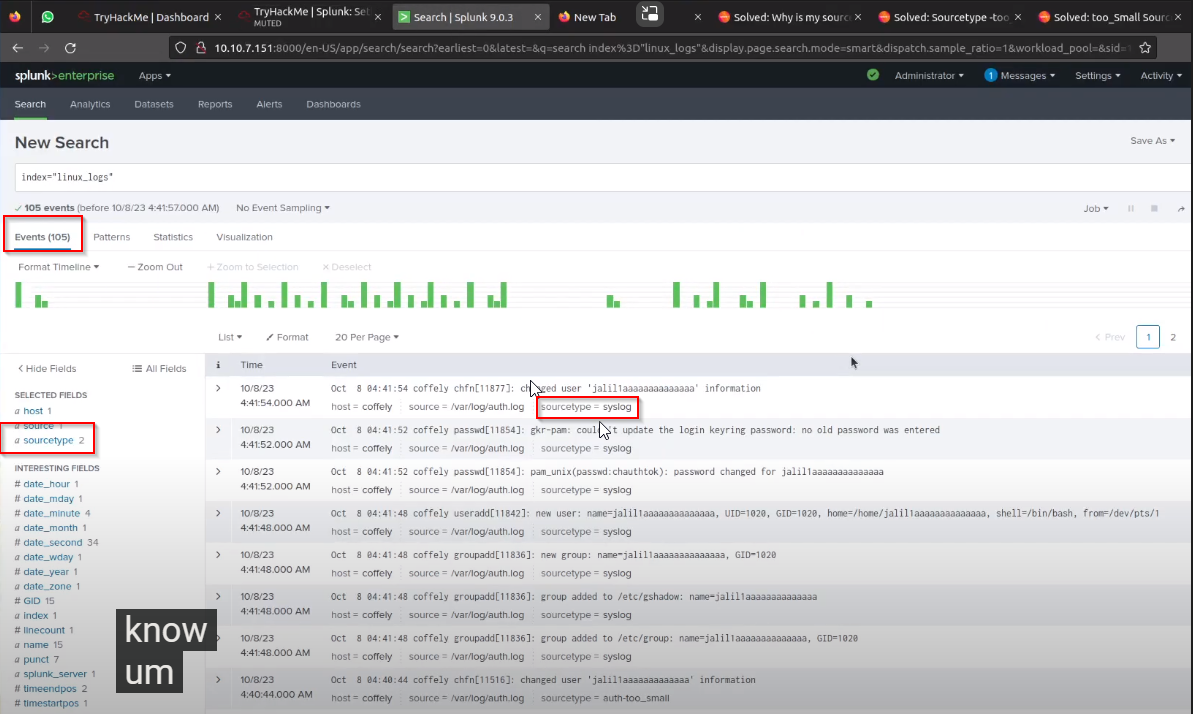
1
- Source type is now "syslog" instead of "auth-too_small"
- Create a new user named analyst using the command
adduser analyst. Once created, look at the events generated in Splunk related to the user creation activity. How many events are returned as a result of user creation?
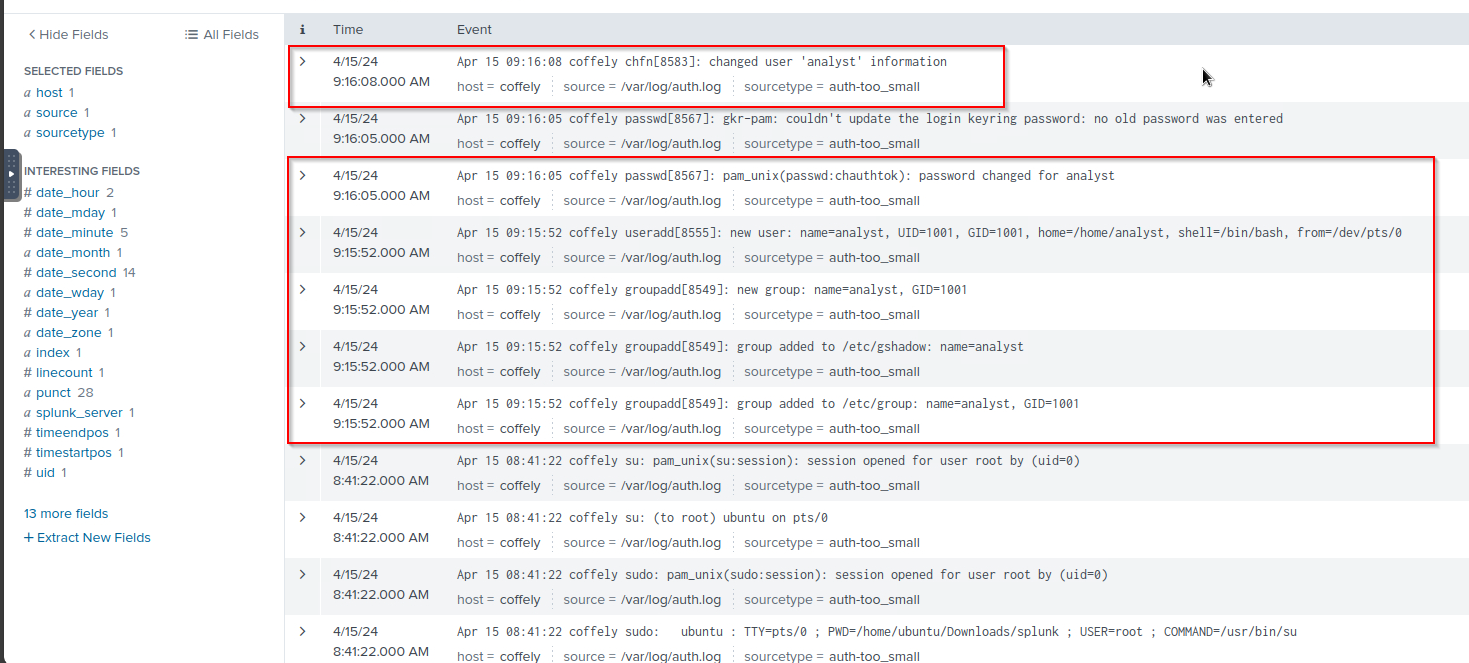
1
6
- What is the path of the group the user is added after creation?

1
/etc/group
Splunk: Installing on Windows
On the Windows machine, we will first install Splunk, configure a forwarder to capture Windows Event logs, and integrate Coffely weblogs to collect all requests and responses into Splunk Instance.
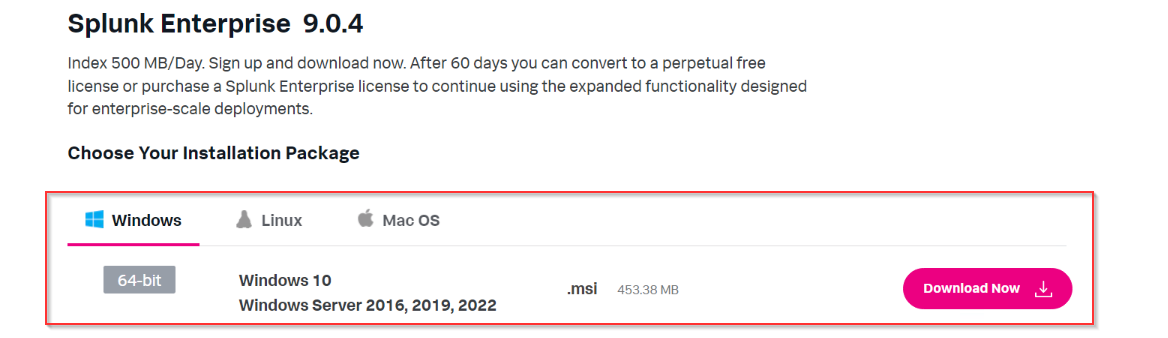
Downloading Splunk Enterprise
1. The first step would be to log in to the Splunk portal and download the Splunk Enterprise instance from the website, as shown below:
2. The installer Splunk-Instance is already been downloaded and placed in the Downloads folder to speed up the process.
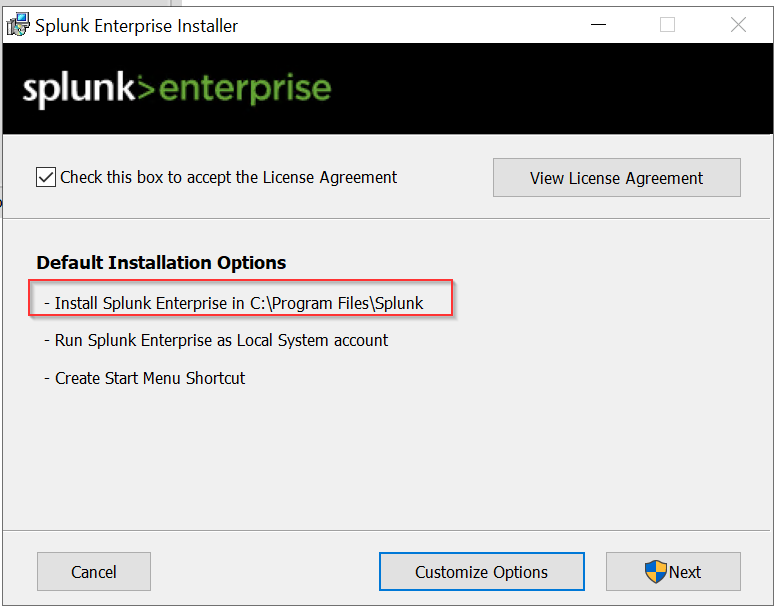
3. Run the Splunk-Instance installer. By default, it will install Splunk in the folder C:\Program Files\Splunk. This will check the system for dependencies and will take 5-8 minutes to install the Splunk instance.
First, click the Check this box to accept the License Agreement and click Next.
Create Administration Account
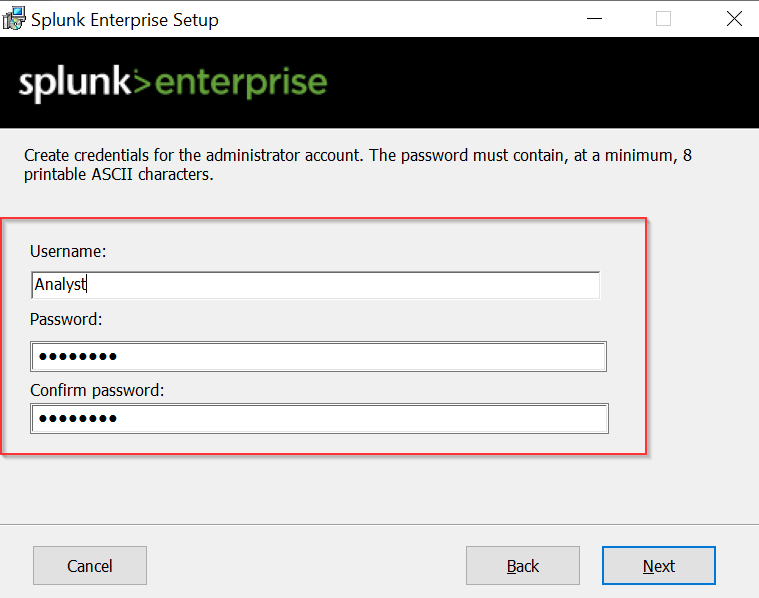
4. The important step during installation is creating an administrator account, as shown below. This account will have high privileges, create and manage other accounts, and control all administrative roles.
It will look for the system requirement for compatibility and other checks.
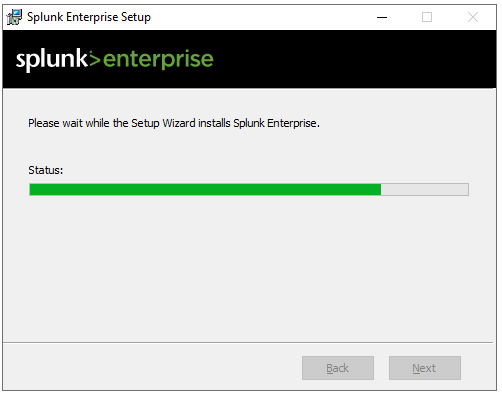
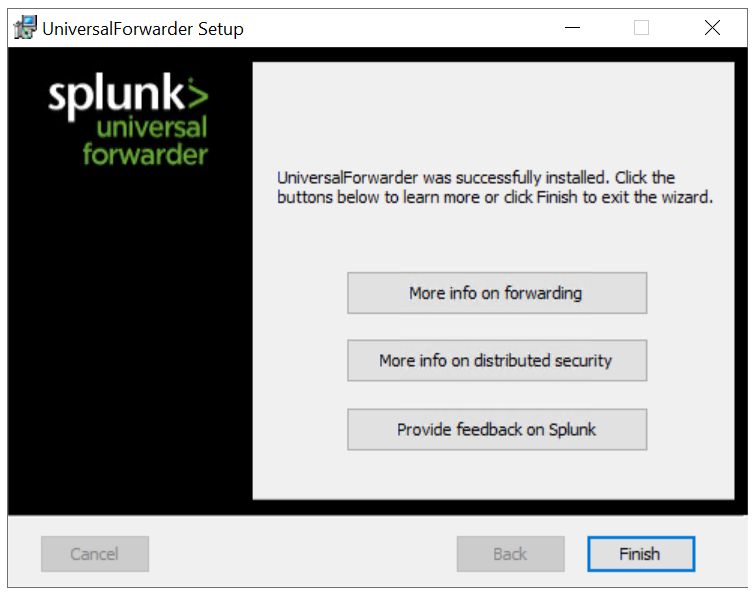
We will get the following message if all system requirements are met, and installation is complete.
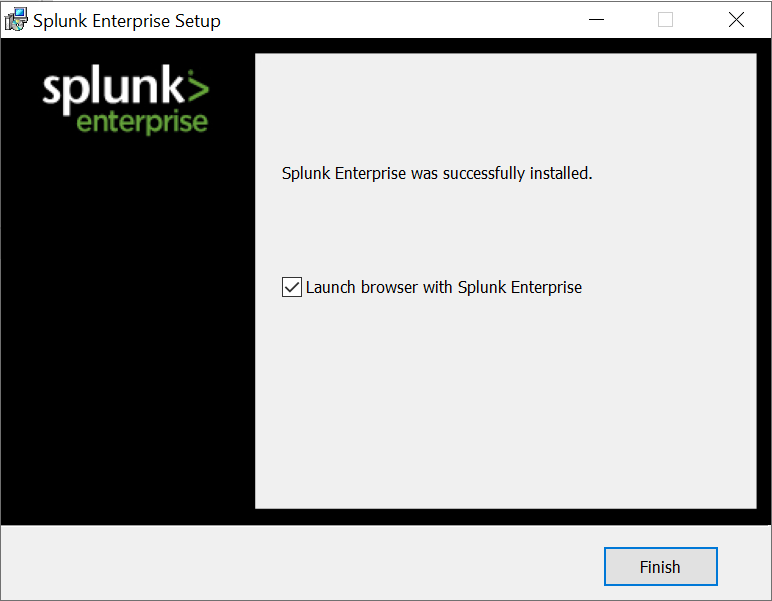
Accessing Splunk Instance
5. Splunk is installed on port 8000 by default. We can change the port during the installation process as well. Now open the browser in the lab and go to the URL HTTP://127.0.0.1:8000. If you are connected with the VPN, then you can also access the newly installed Splunk Instance in your browser by going to http://127.0.0.1:8000.
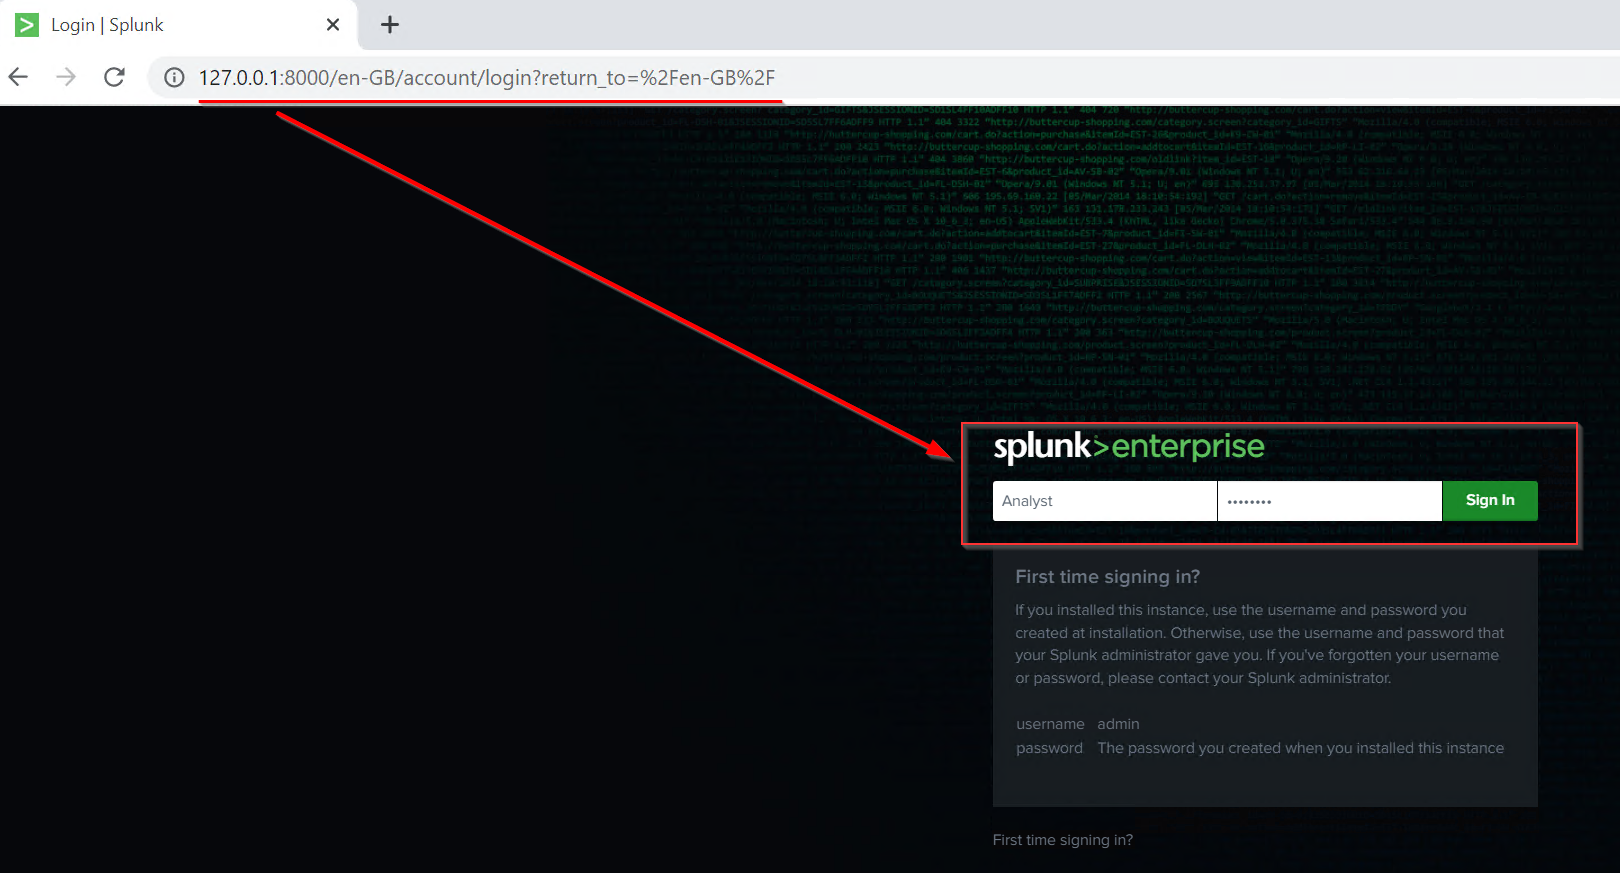
6. Use the credentials created during the installation process to get the Splunk dashboard. 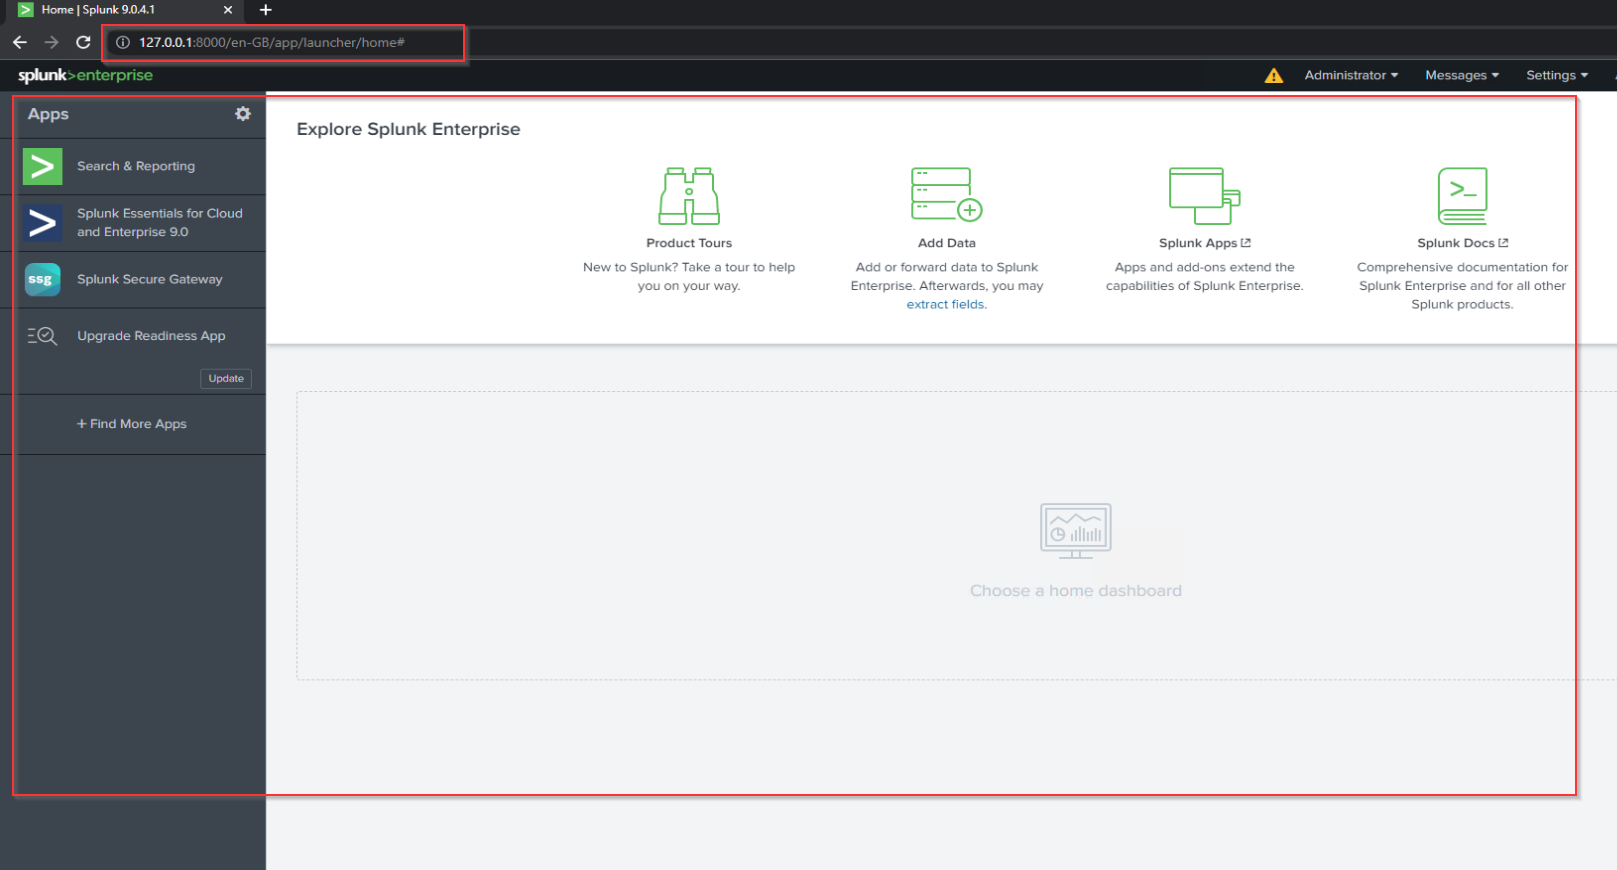
Installing and Configuring a Forwarder
7. First, we will configure the receiver on Splunk so the forwarder knows where to send the data.
Configure Receiving
8. Log into Splunk and Go to Settings -> Forward and receiving tab as shown below: 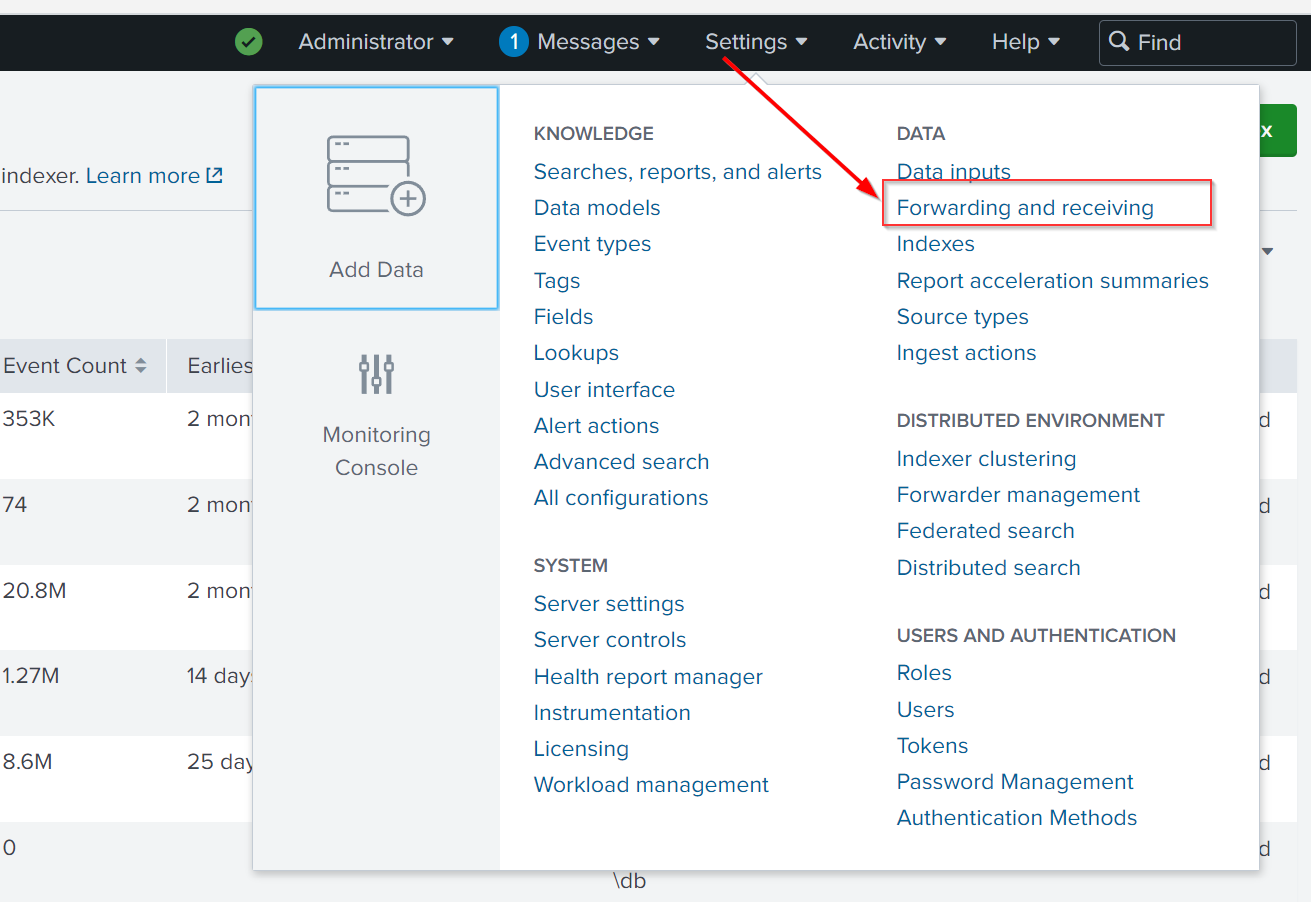
9. It will show multiple options to configure both forwarding and receiving. As we want to receive data from the Windows Endpoint, we will click on Configure receiving and then proceed by configuring a new receiving port. 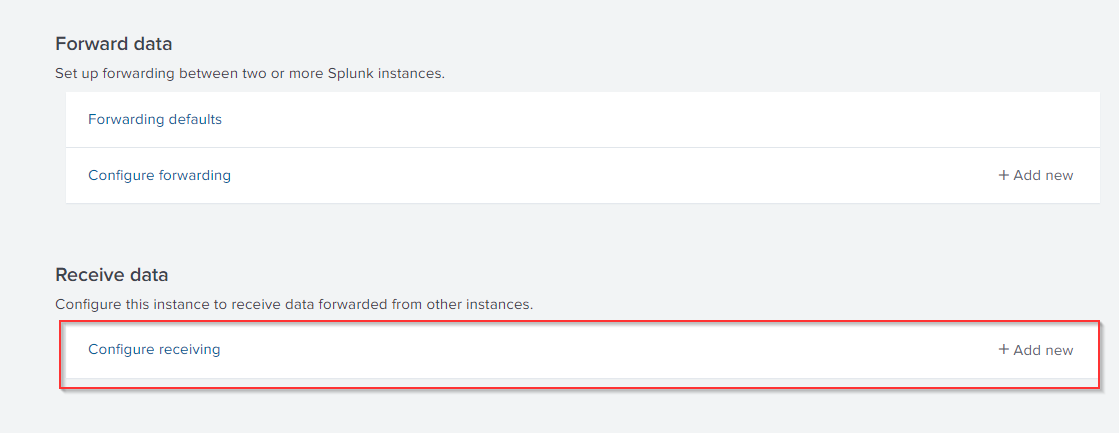
By default, the Splunk instance receives data from the forwarder on port 9997. It’s up to us to use this port or change it. For now, we will configure our Splunk to start listening on port 9997 and Save, as shown below: 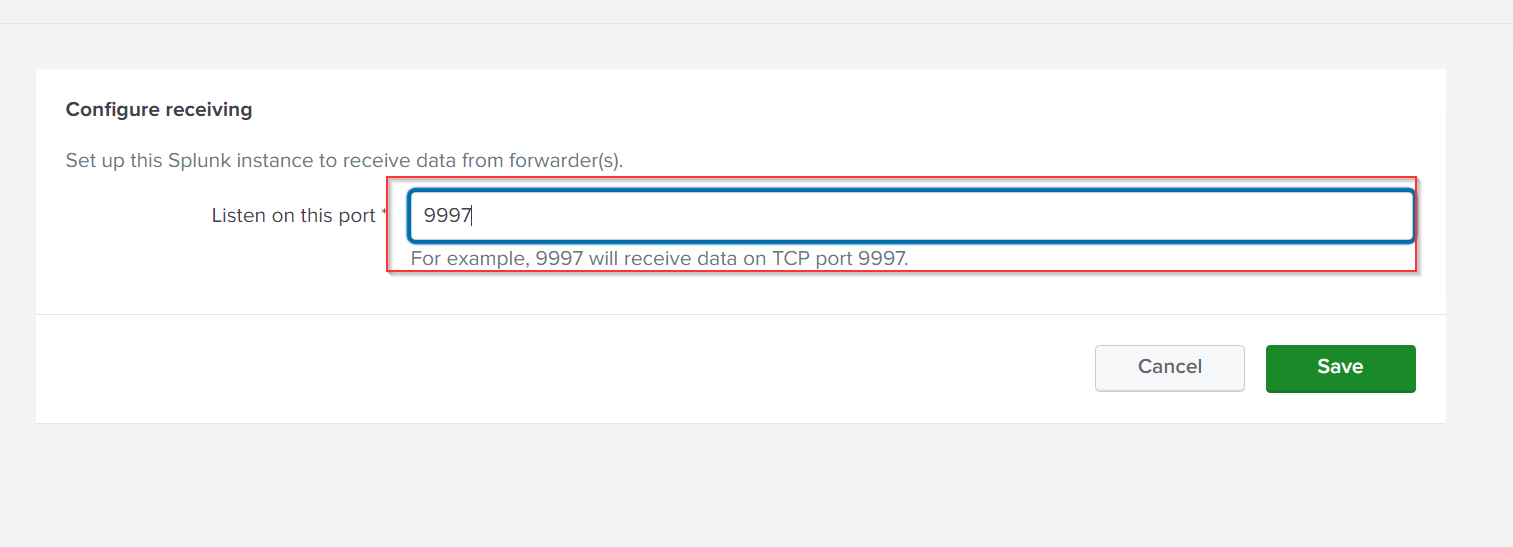
Installing Splunk Forwarder
10. Installing Splunk Forwarder is very straightforward. First, we will download the latest forwarder from the official website here. As of writing this, Splunk Forwarder 9.0.4 is the newest version available on the site.
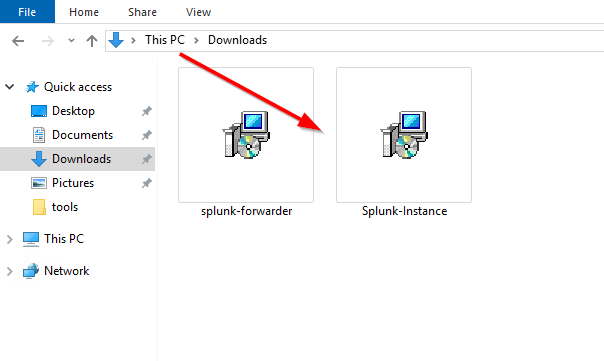
11. For this lab, the forwarder is already downloaded and placed in the Downloads folder, as shown below: 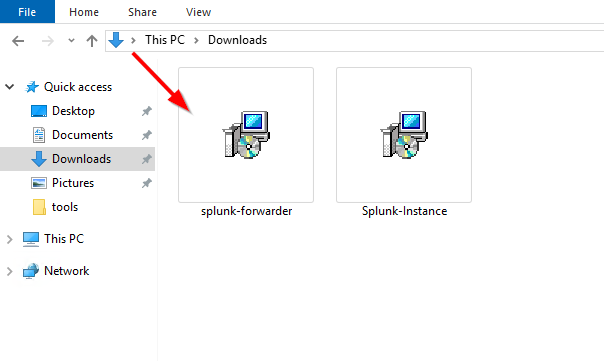
Installation Process
12. Click on the installer and begin installing Splunk Forwarder, as shown below. Don’t forget to click the Check this box to accept the License Agreement. Select the Select the On-Premises Option as we are installing it on an on-premises appliance. 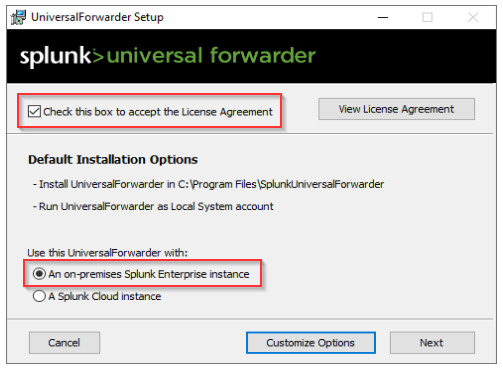
13. Create an account for Splunk Forwarder. This will be used when connecting the Splunk forwarder to the Splunk Indexer. 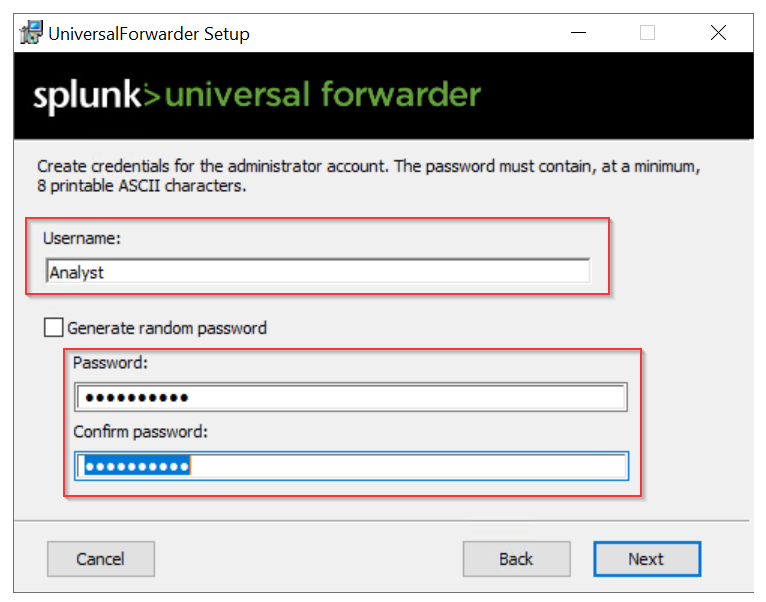
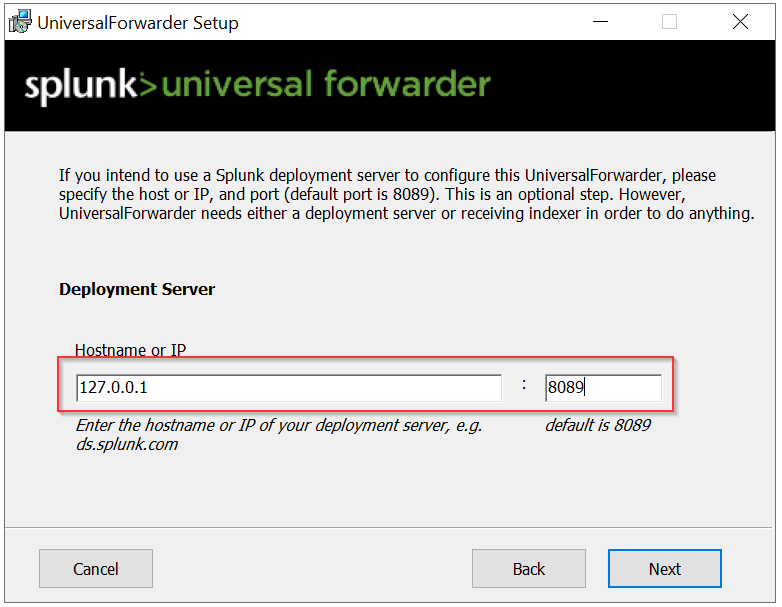
Setting up Deployment Server
14. This configuration is important if we install Splunk forwarder on multiple hosts. We can skip this step as this step is optional.
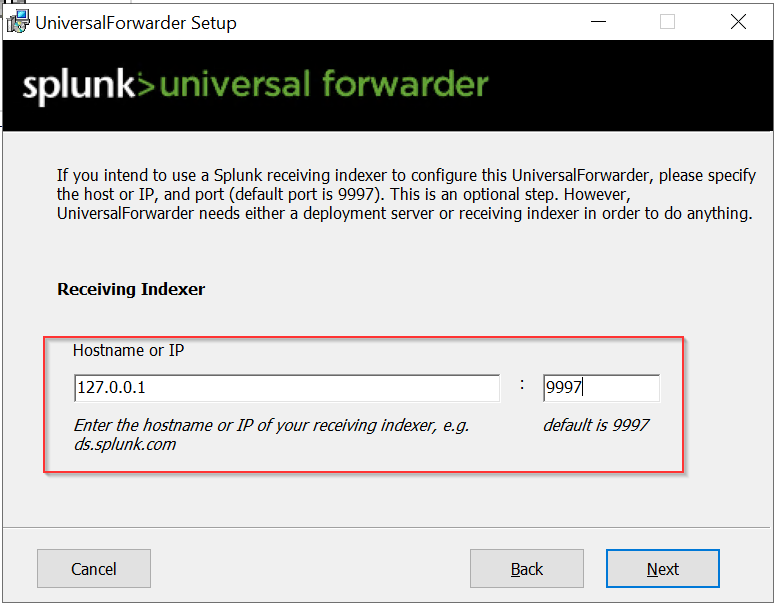
Setting Up Listener
15. We must specify the server’s IP address and port number to ensure that our Splunk instance gets the logs from this host. By default, Splunk listens on port 9997 for any incoming traffic.
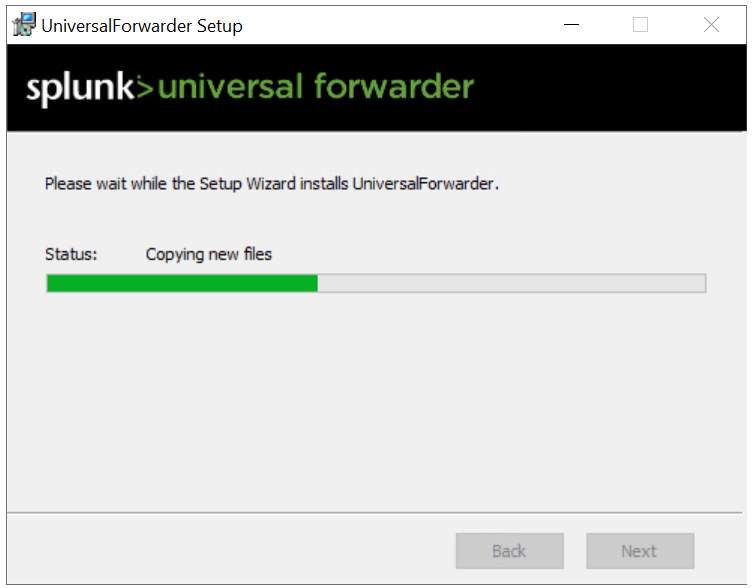
1
- Installing the forwarder on a Windows endpoint will take 3-5 minutes.
If we had provided the information about the deployment server during the installation phase, our host details would be available in the Settings -> Forwarder Management tab, as shown below: 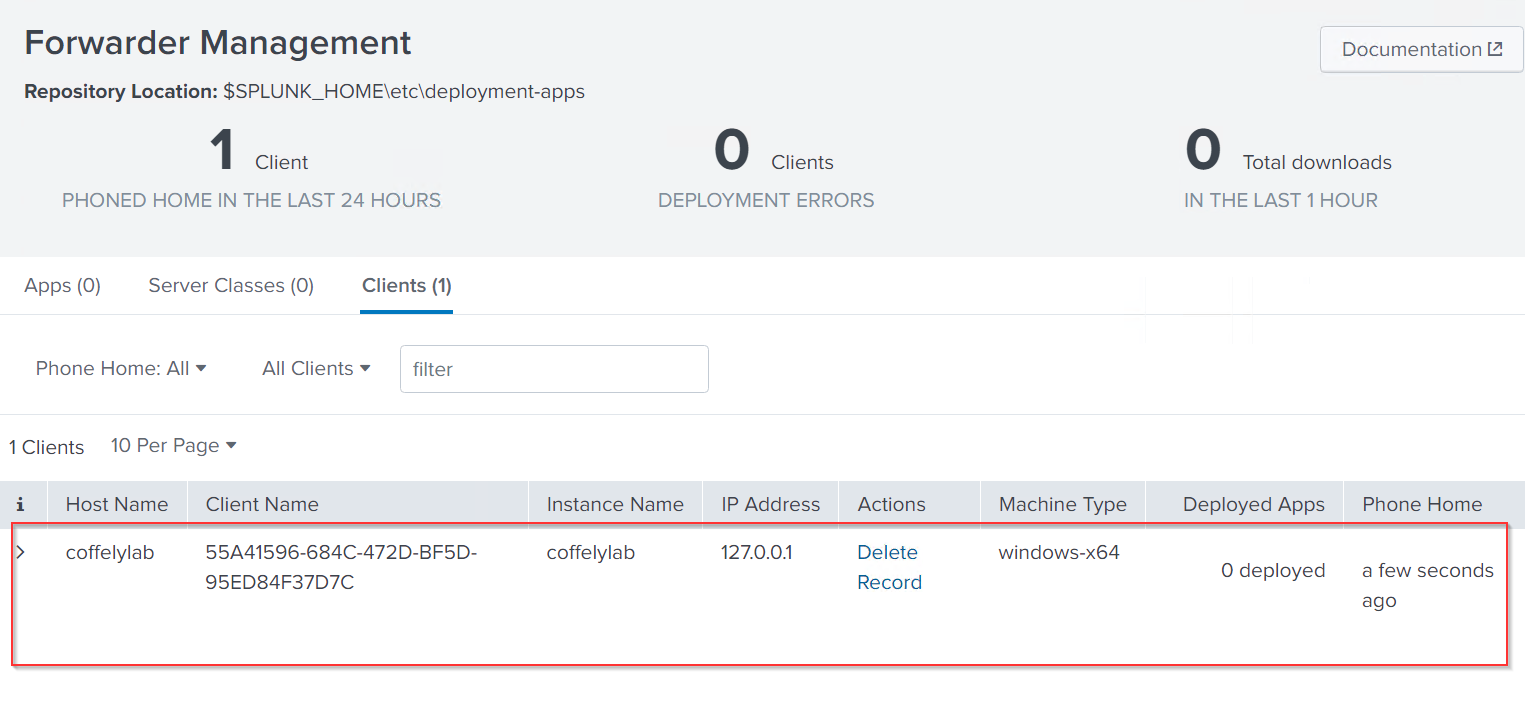
1
- Now that Splunk forwarder is installed, we will now configure our forwarder to send logs to our Splunk instance in the upcoming tasks.
Splunk: Ingesting Windows Logs
16. We have installed the forwarder and set up the listener on Splunk. It’s time to configure Splunk to receive Event Logs from this host and configure the forwarder to collect Event Logs from the host and send them to the Splunk Indexer. Let’s go through this step by step.
Check Forwarder Management
17. The Forwarder Management tab views and configures the deployment of servers/hosts. 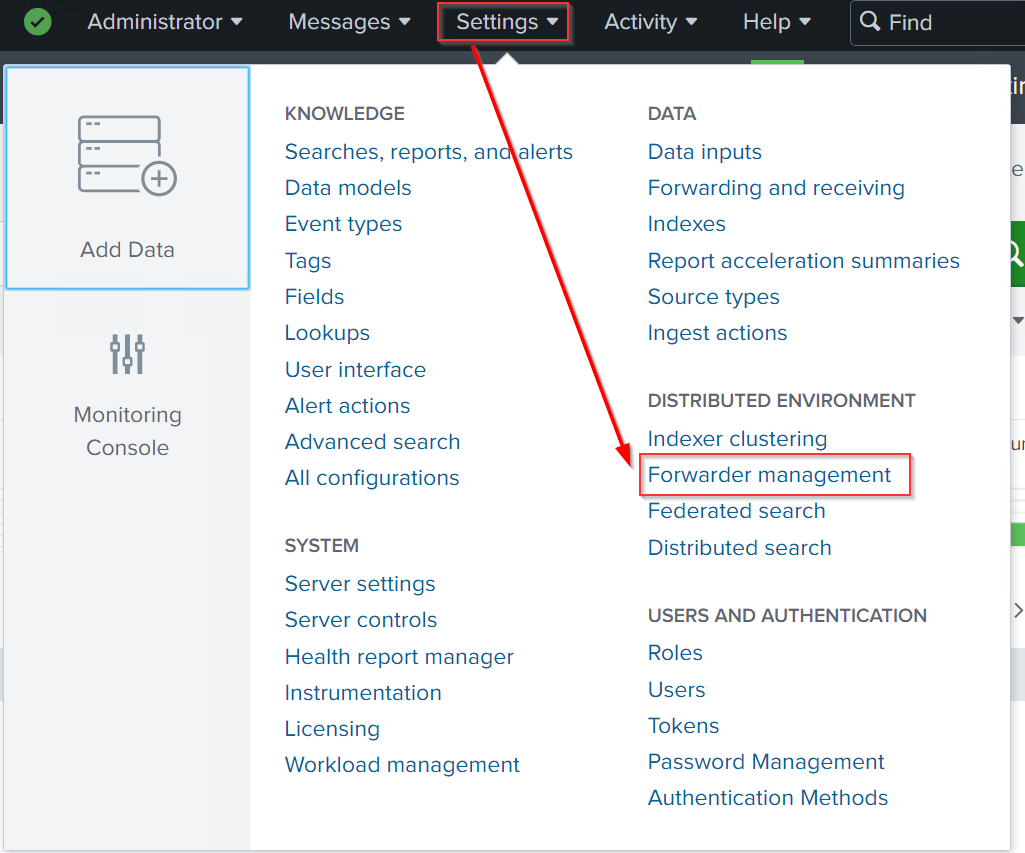
18. Go to settings -> Forwarder Management tab to get the details of all deployment hosts. In an actual network, this tab will be filled with all the hosts and servers configured to send logs to Splunk Indexer. 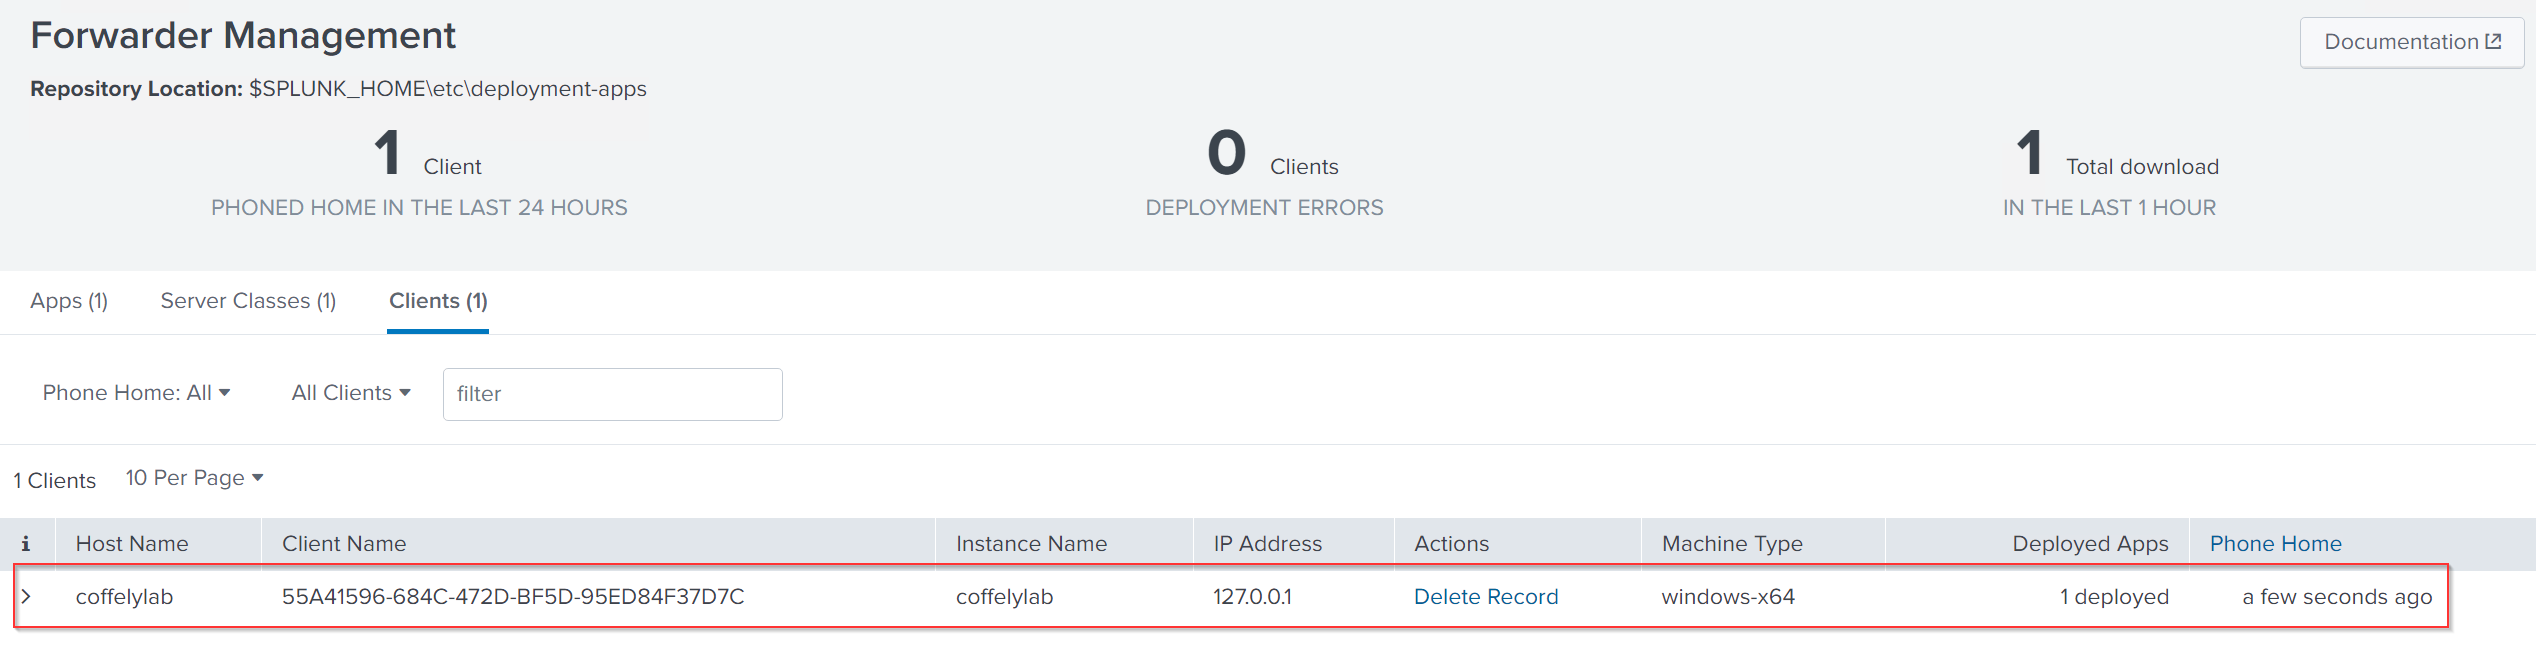
1
- It will appear here if we have properly configured the forwarder on the host. Now it's time to configure Splunk to receive the Event Logs.
Select Forwarder
19. Click on Settings -> Add data. It shows all the options to add data from different sources. 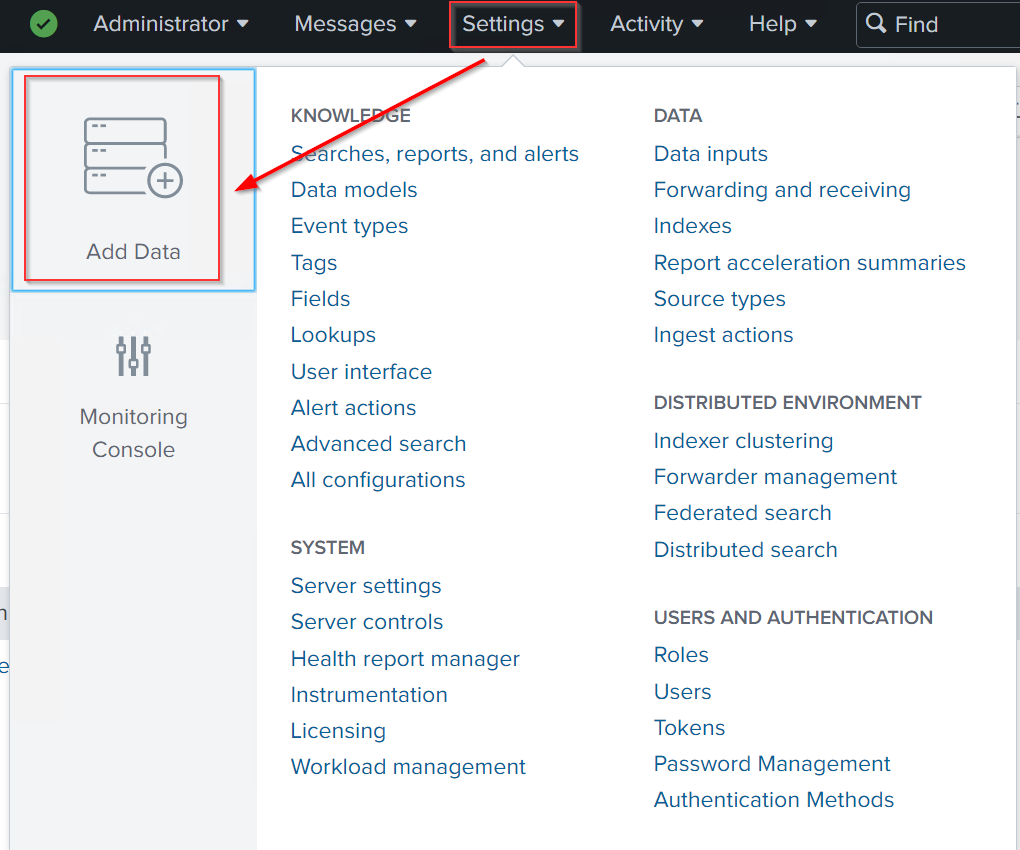
20. It provides us with three options for selecting how to ingest our data. We will choose the Forward option to get the data from Splunk Forwarder. 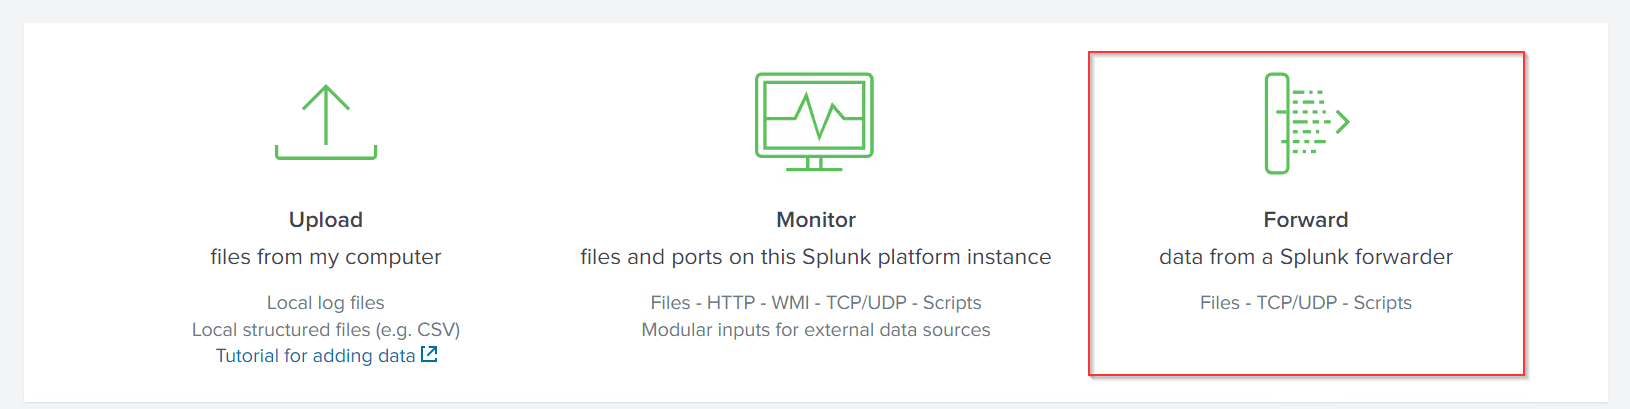
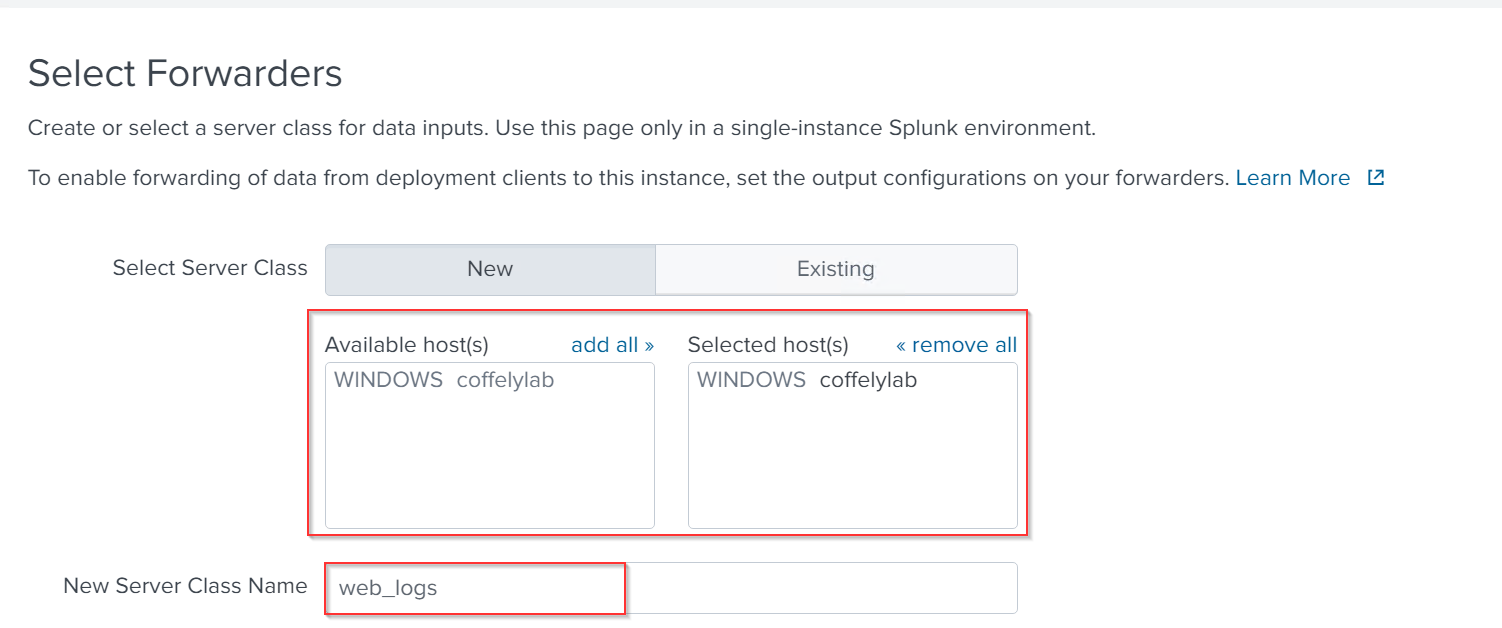
21. In the Select Forwarders section, Click on the host coffelylab shown in the Available host(s) tab, and it will be moved to the Selected host(s) tab. Then, click Next. 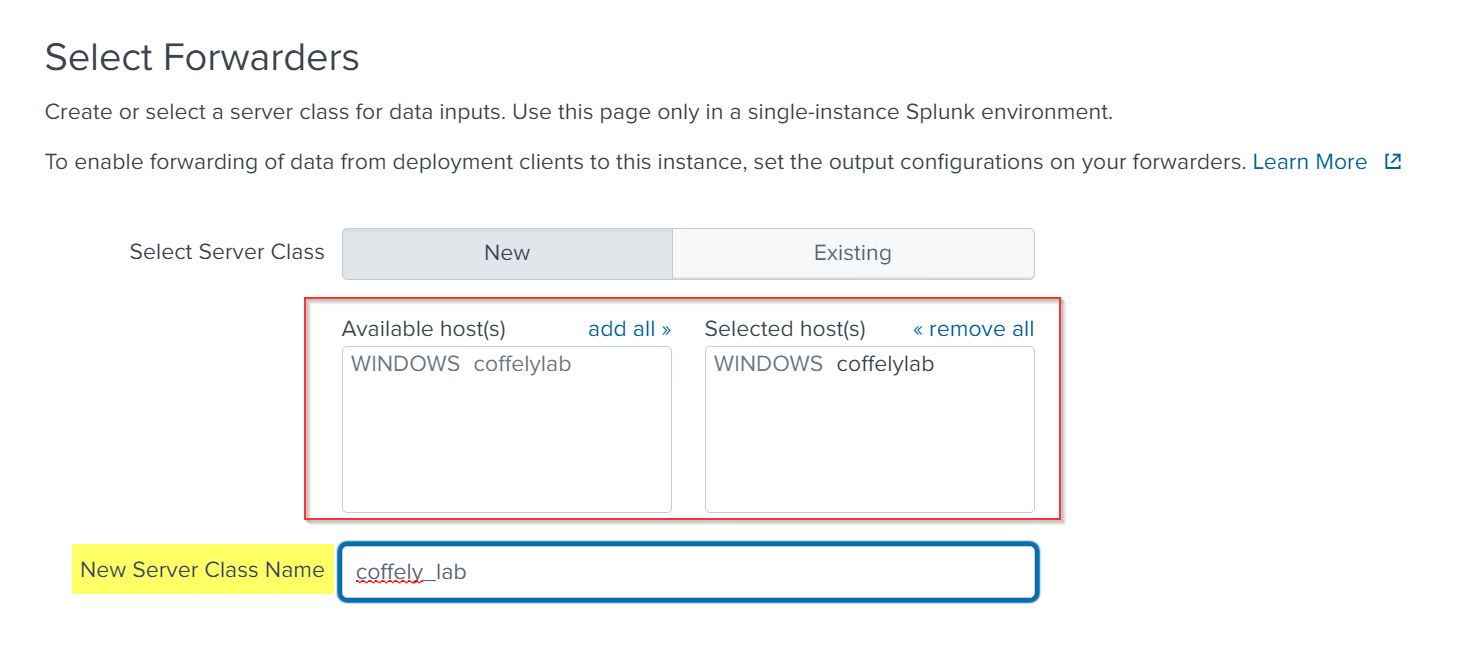
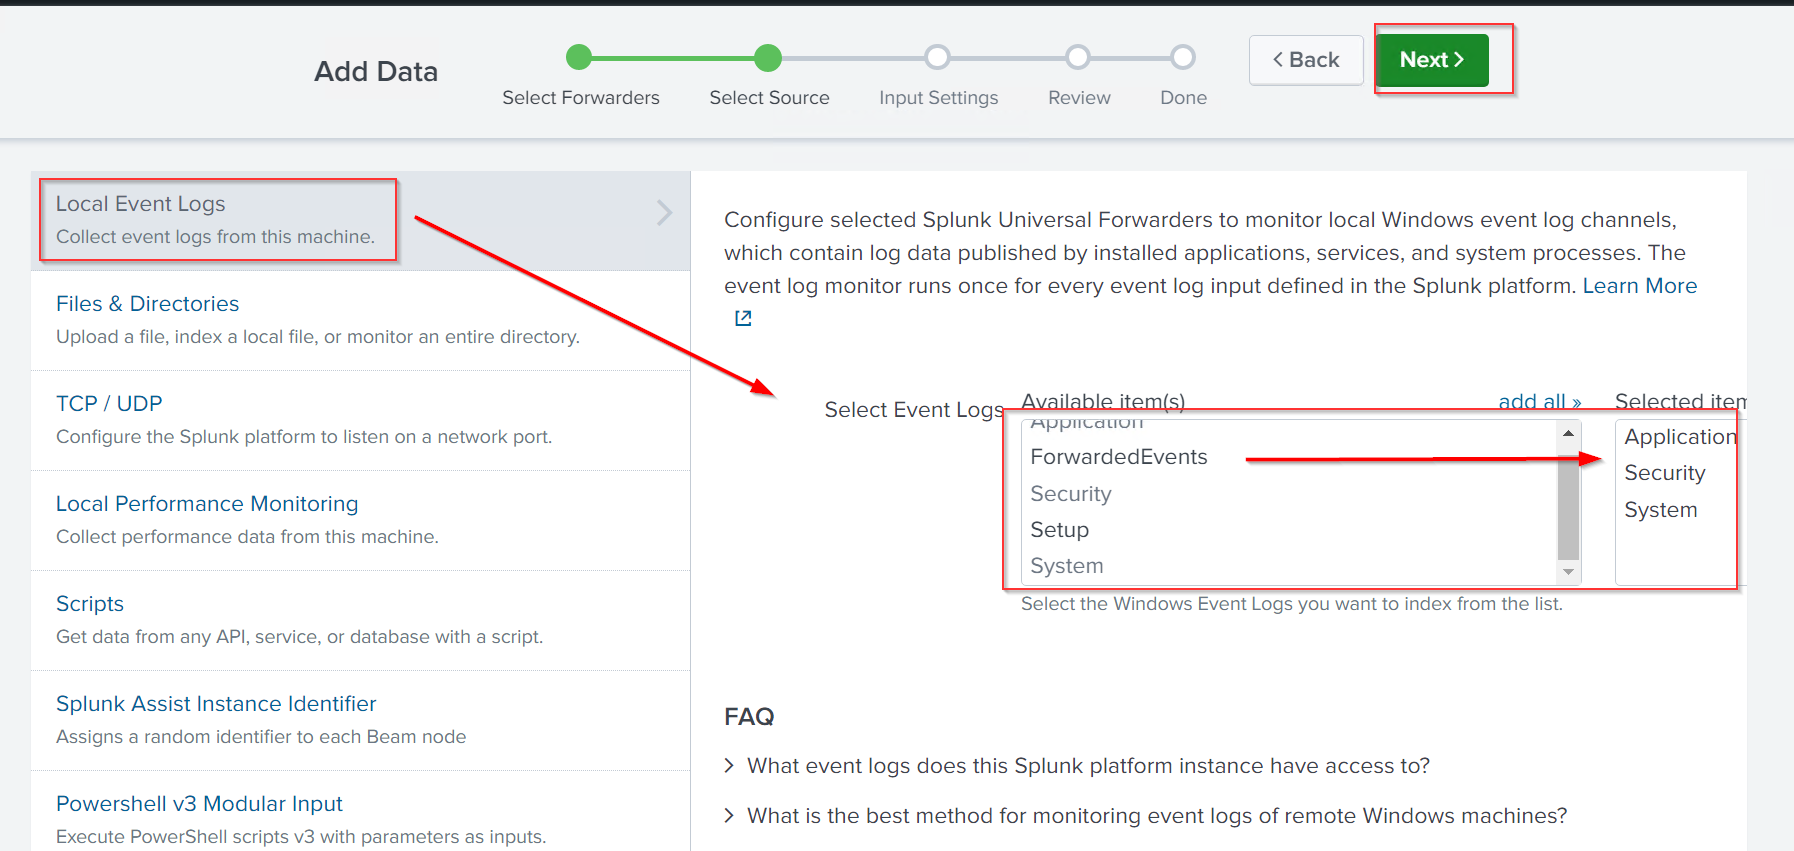
Select Source
22. It’s time to select the log source that we need to ingest. The list shows many log sources to choose from. Click on Local Event Logs to configure receiving Event Logs from the host. Different Event Logs will appear in the list to choose from. As we know, various Event Logs are generated by default on the Windows host. More about Event Logs can be learned in this Windows Event Logs room. Let’s select a few of those and move to the next step.
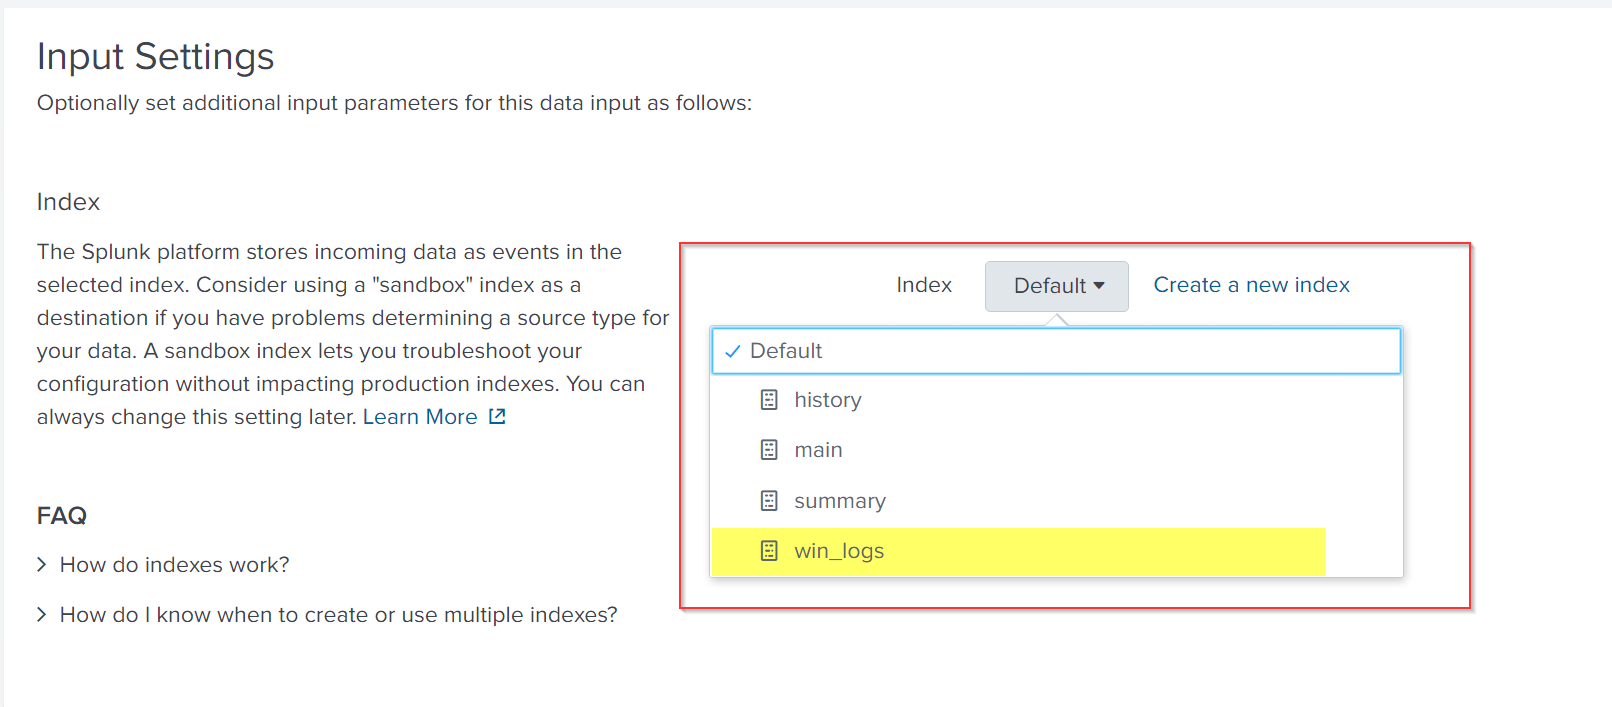
Creating Index
23. Create an index that will store the incoming Event logs. Once created, select the Index from the list and move to the next step.
Review
24. The review tab summarizes the settings we just did to configure Splunk. Move to the next step.
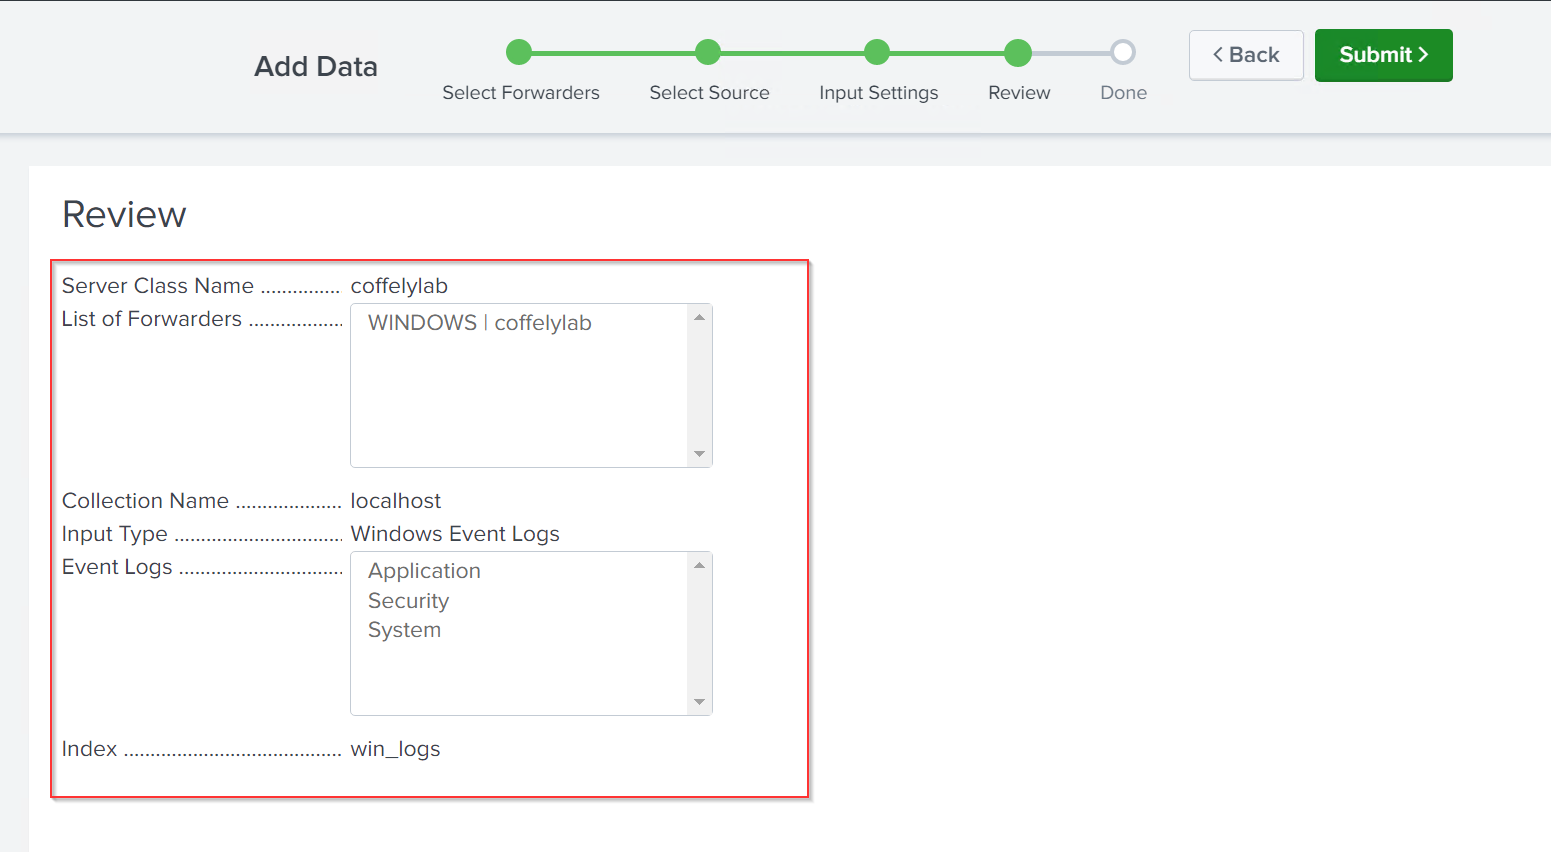
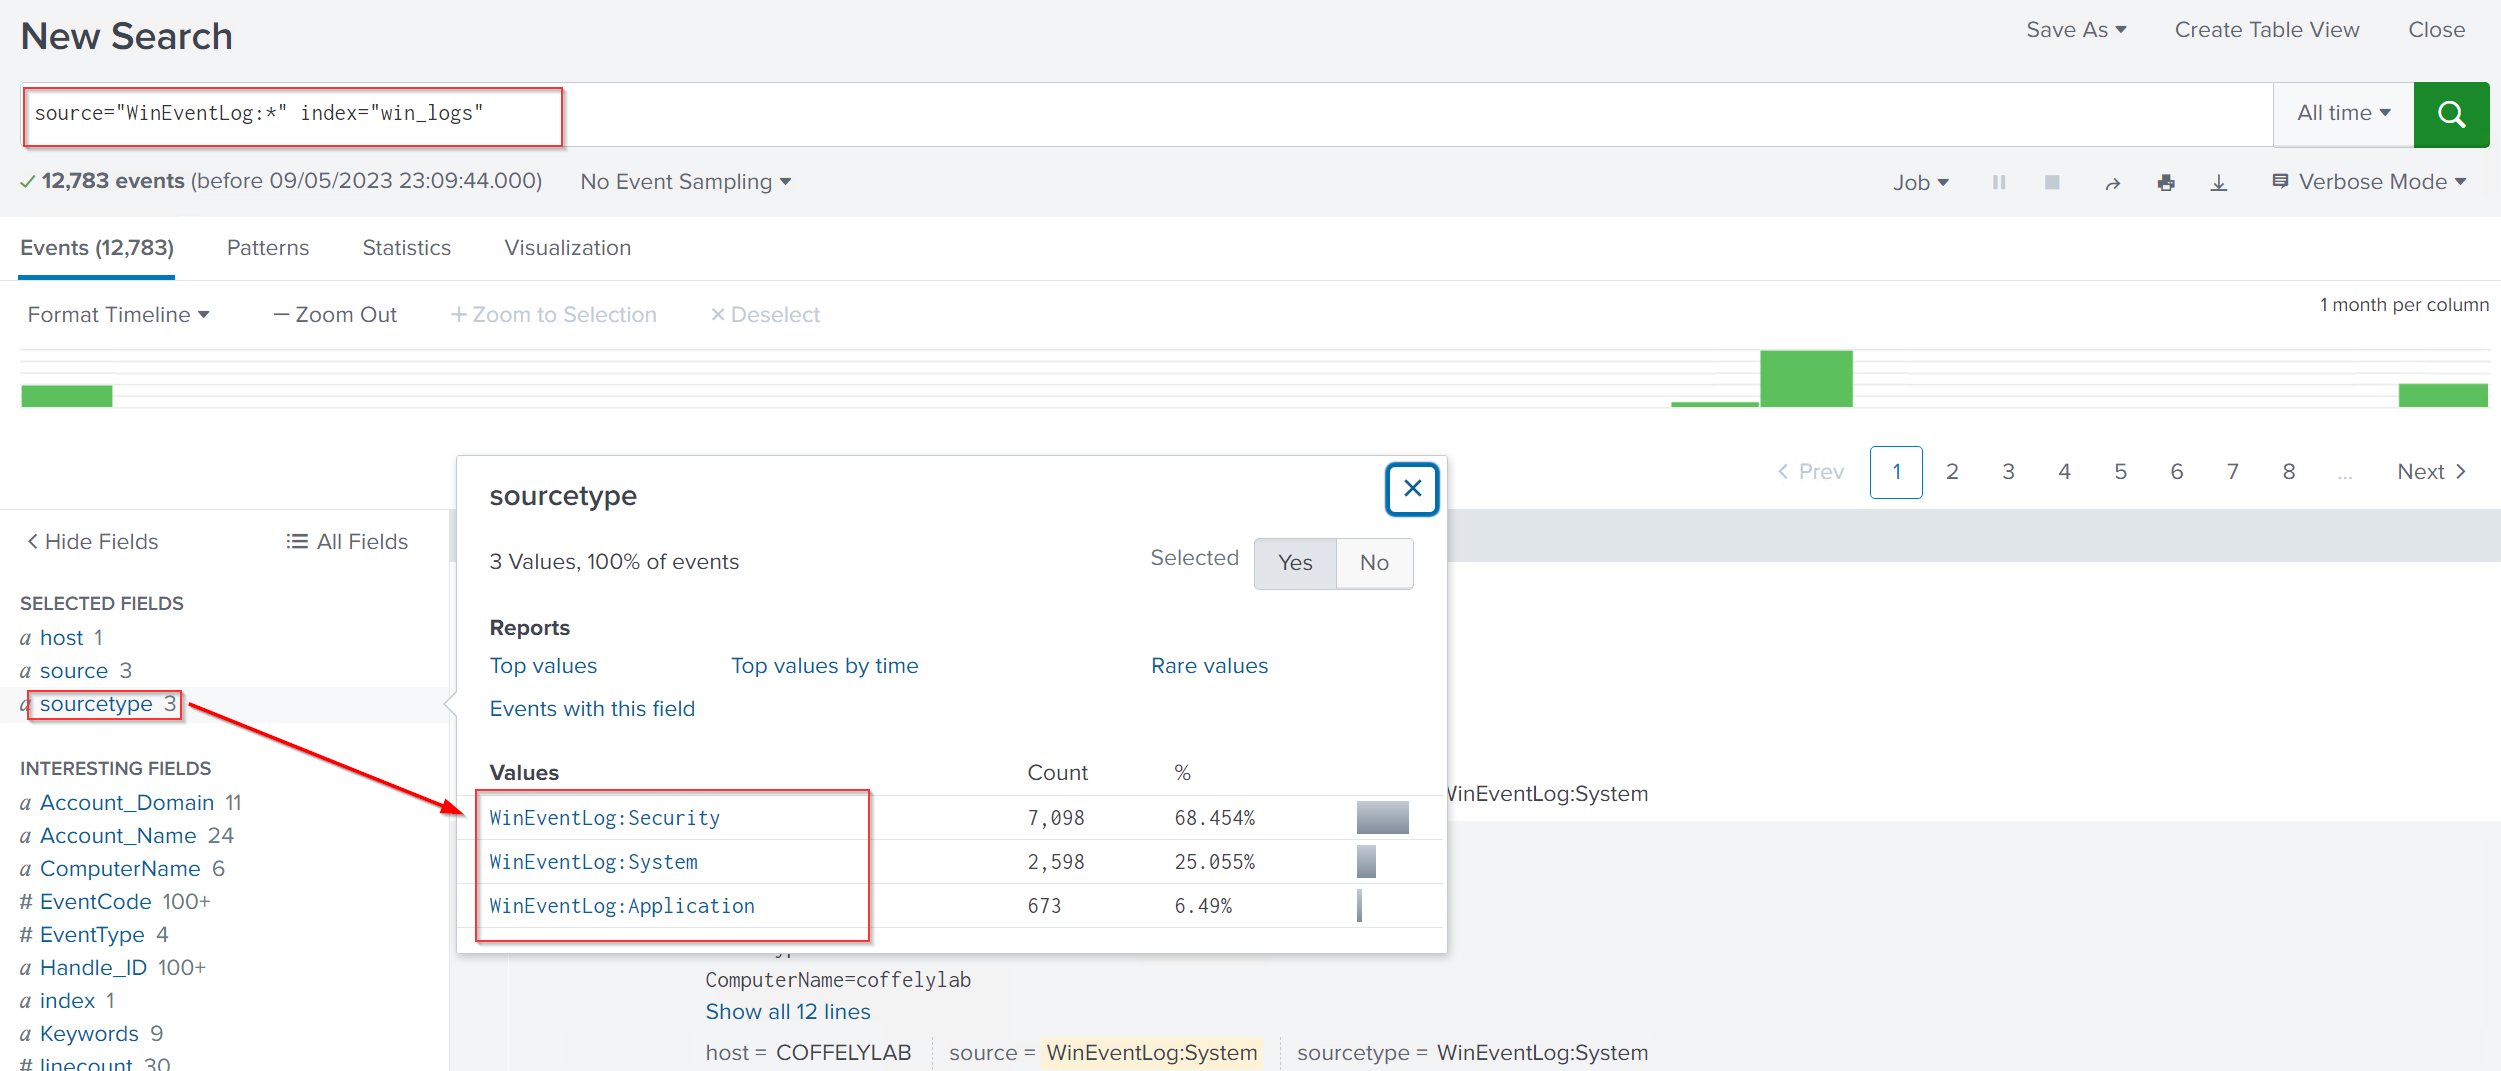
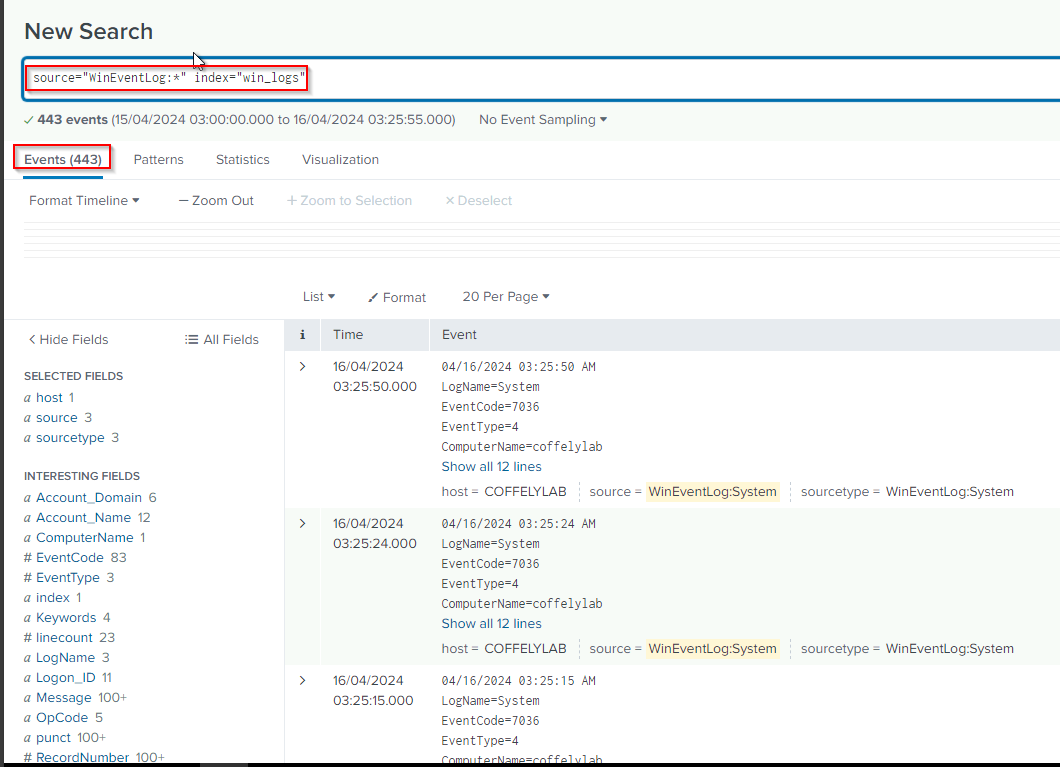
25. Click on the Start Searching tab. It will take us to the Search App. If everything goes smoothly, we will receive the Event Logs immediately.
1
source="WinEventLog:*" index="win_logs"
Question and Answers section:
- While selecting Local Event Logs to monitor, how many Event Logs are available to select from the list to monitor? Answer:
1
5 - Search for the events with
EventCode=4624. What is the value of the field Message?![]()
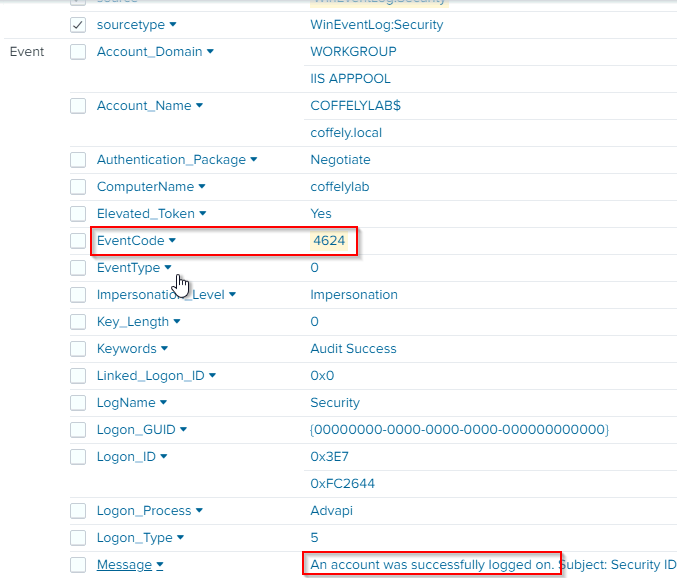
Answer:
1
An account was successfully logged on.
Ingesting Coffely Web Logs
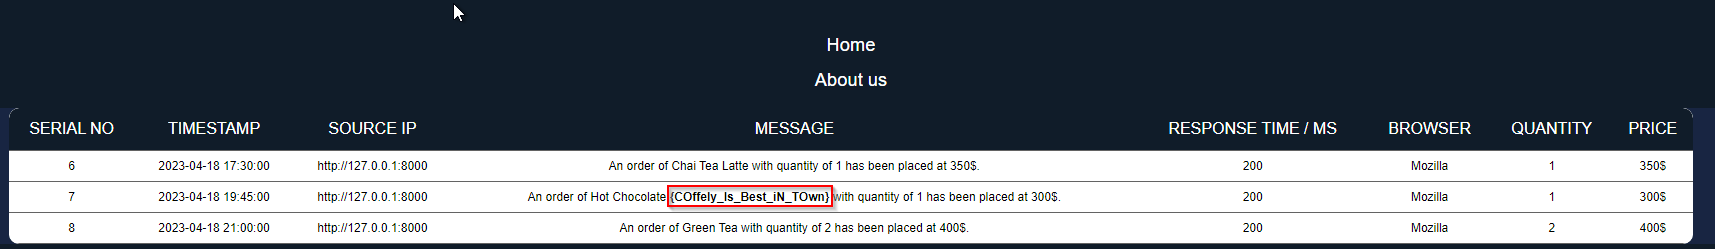
The Windows host we connected to Splunk Instance also hosts a local copy of their website, which can be accessed via http://coffely.thm from the VM and is in the development phase. You are asked to configure Splunk to receive the weblogs from this website to trace the orders and improve coffee sales.
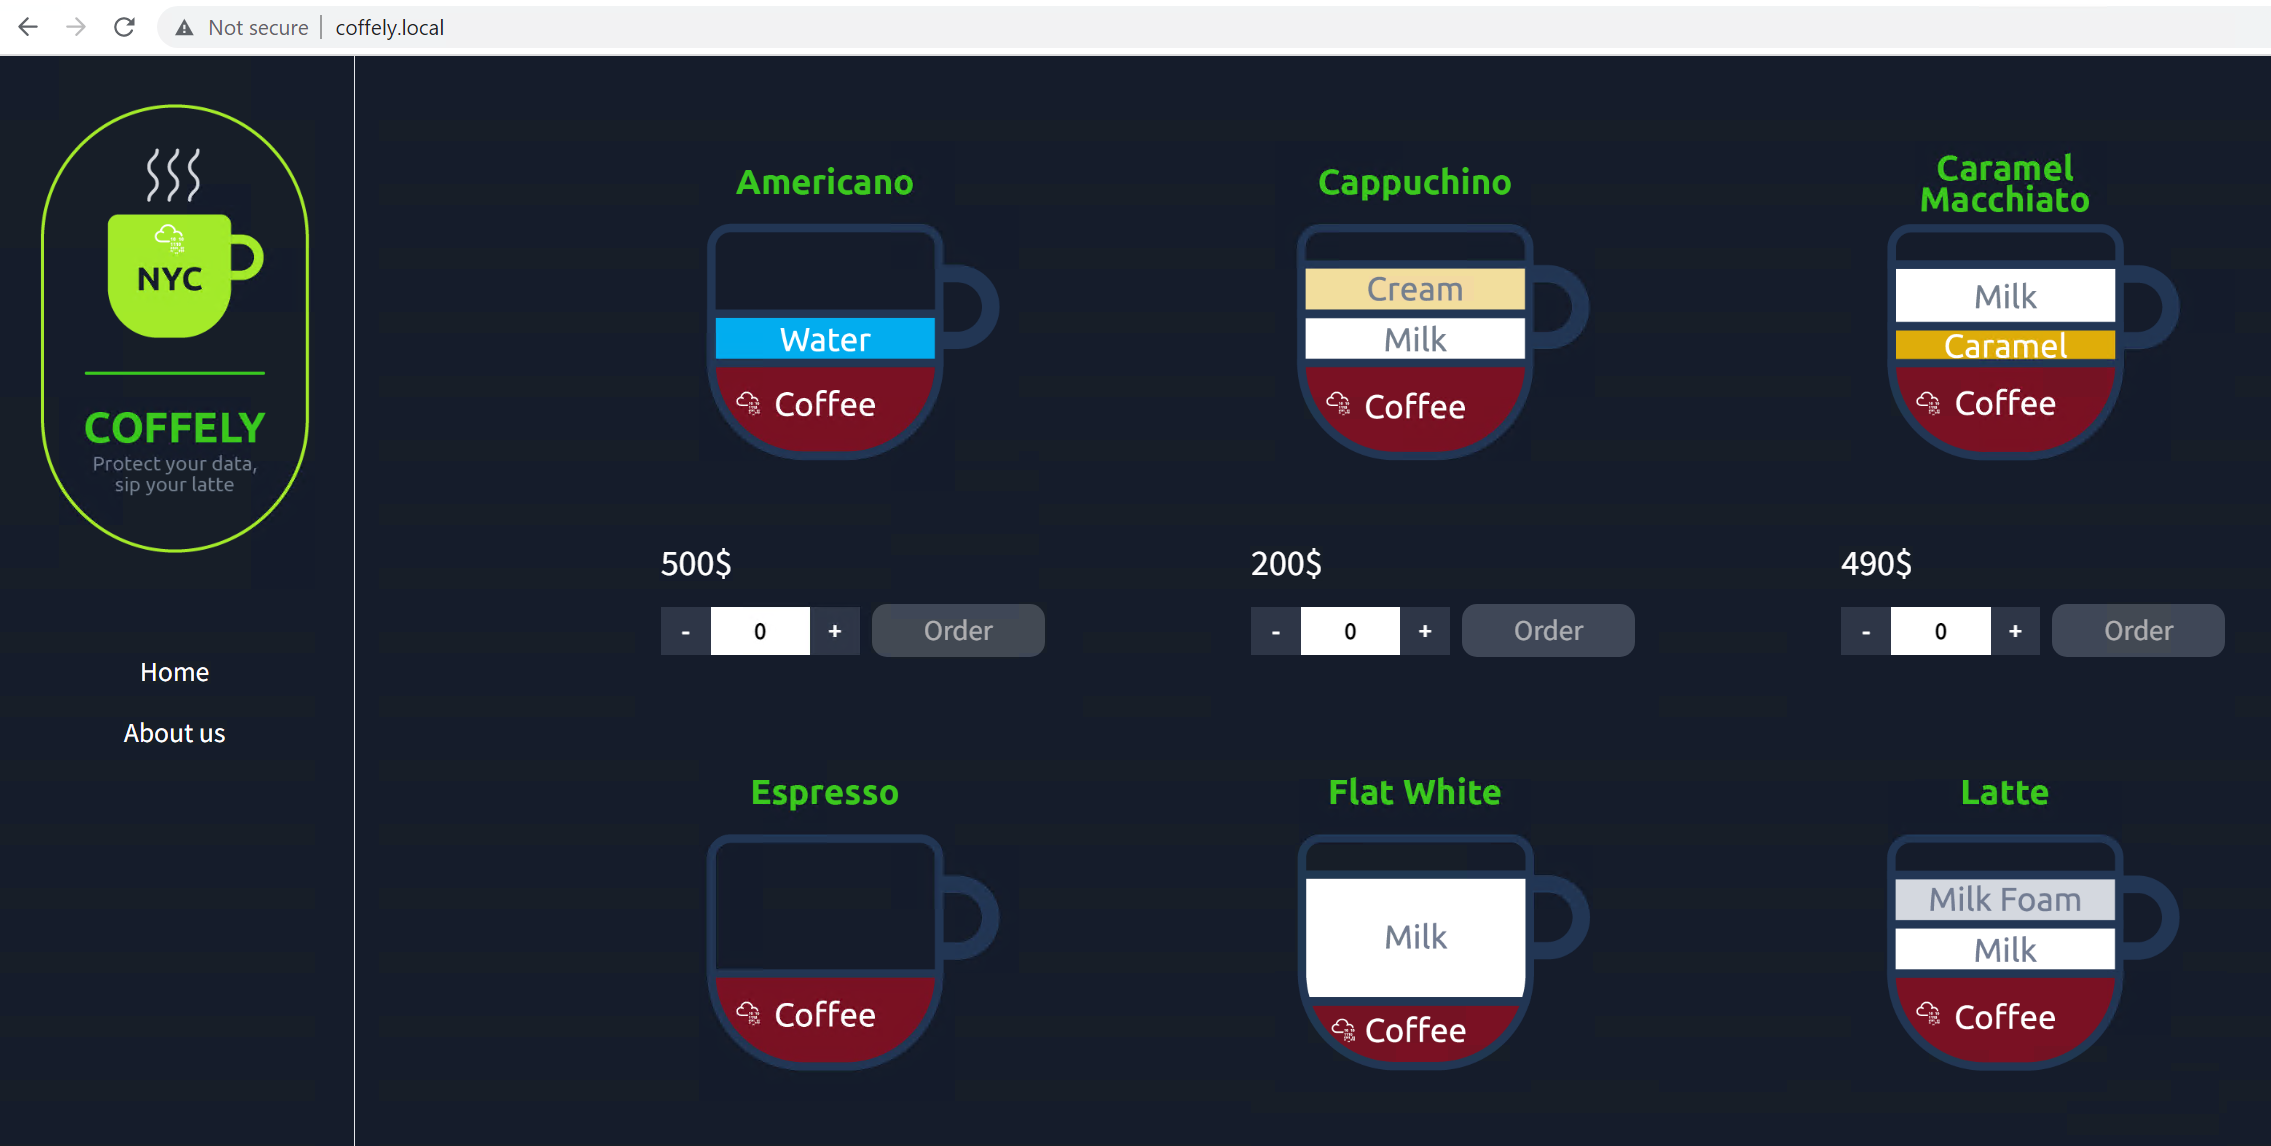
This site will allow users to order coffee online. In the backend, it will keep track of all the requests and responses and the orders placed. Now let’s follow the next steps to ingest web logs into Splunk.
Add Data
26. Go to settings -> Add Data and select Forward from the list, as shown below: 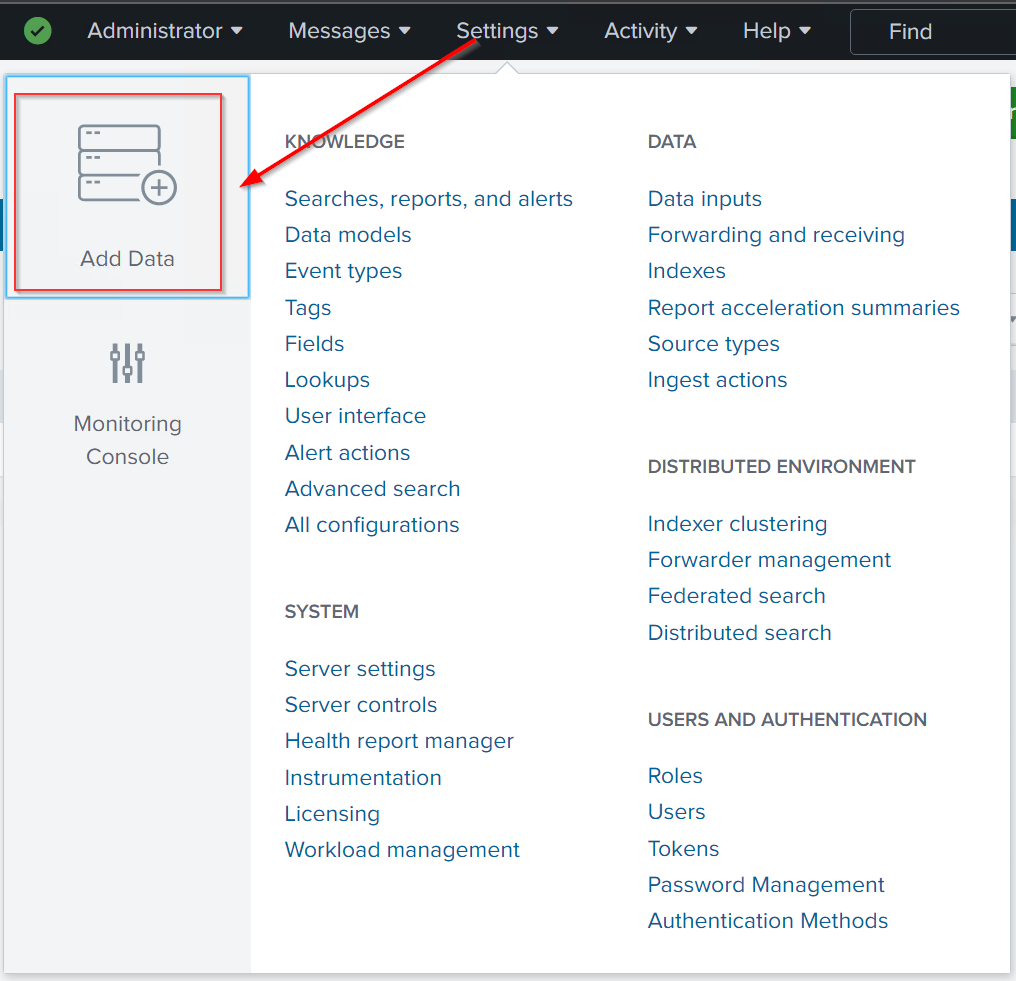
27. Select the Forwarder option: 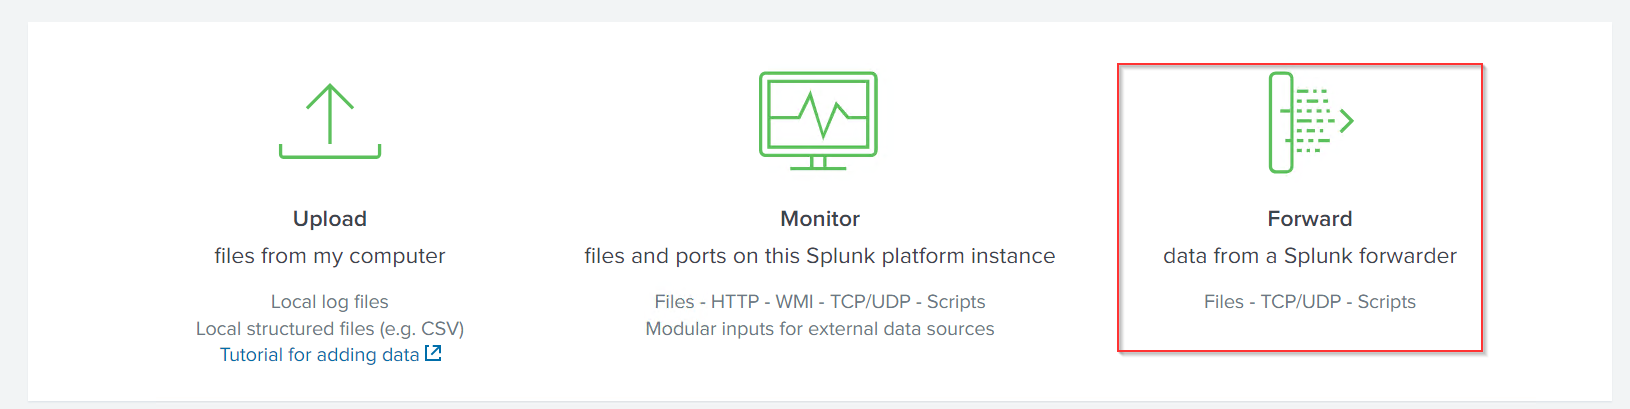
Select Forwarder
28. Here we will select the Web host where the website is being hosted.
29. Web logs are placed in the directory C:\inetpub\logs\LogFiles\W3SVC*. The directory may contain one or more log files which will be continuously updated with the logs. We will be configuring Splunk to monitor and receive logs from this directory. 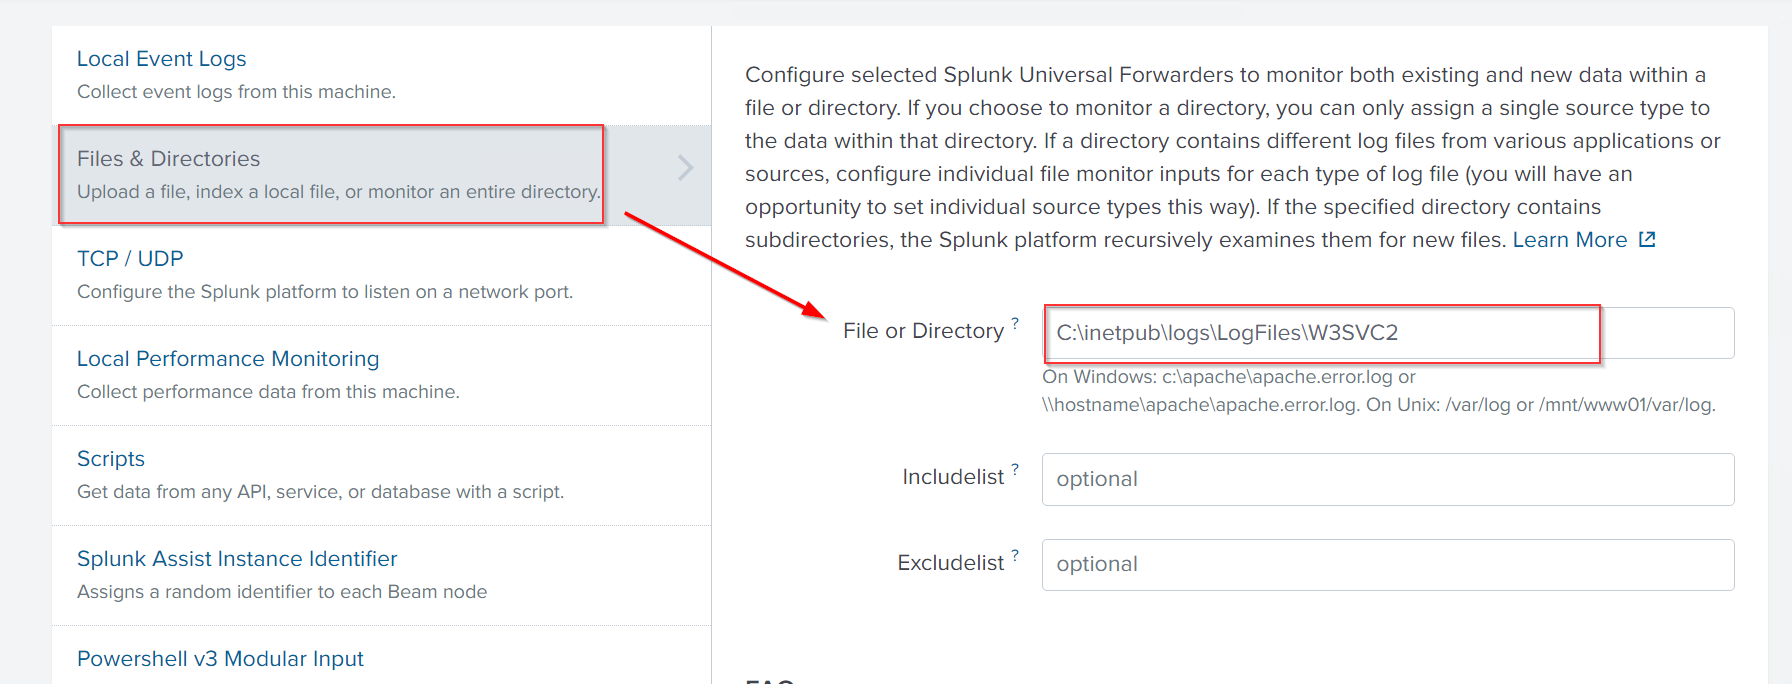
Setting up Source Type
30. Next, we will select the source type for our logs. As our web is hosted on an IIS server, we will choose this option and create an appropriate index for these logs. 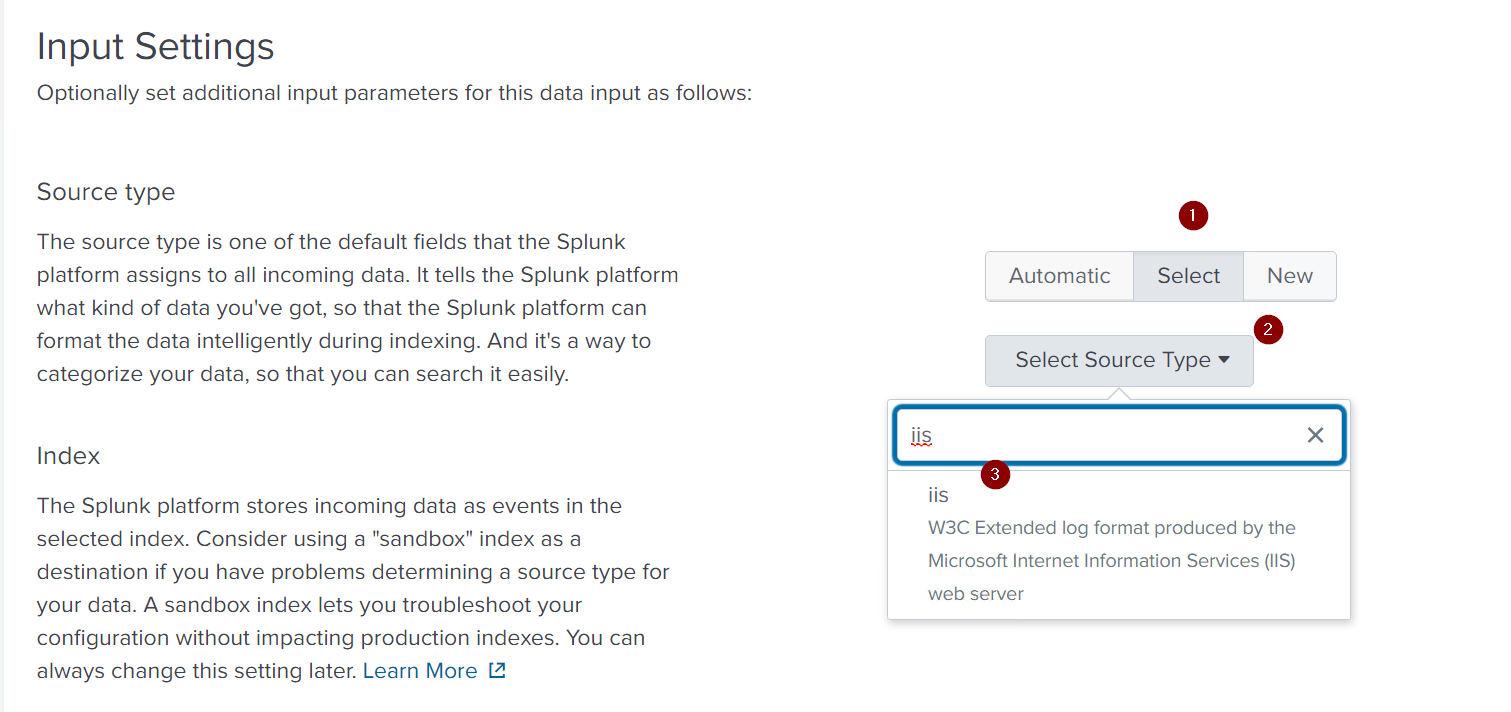
31. We can look at the summary to see if all settings are fine. 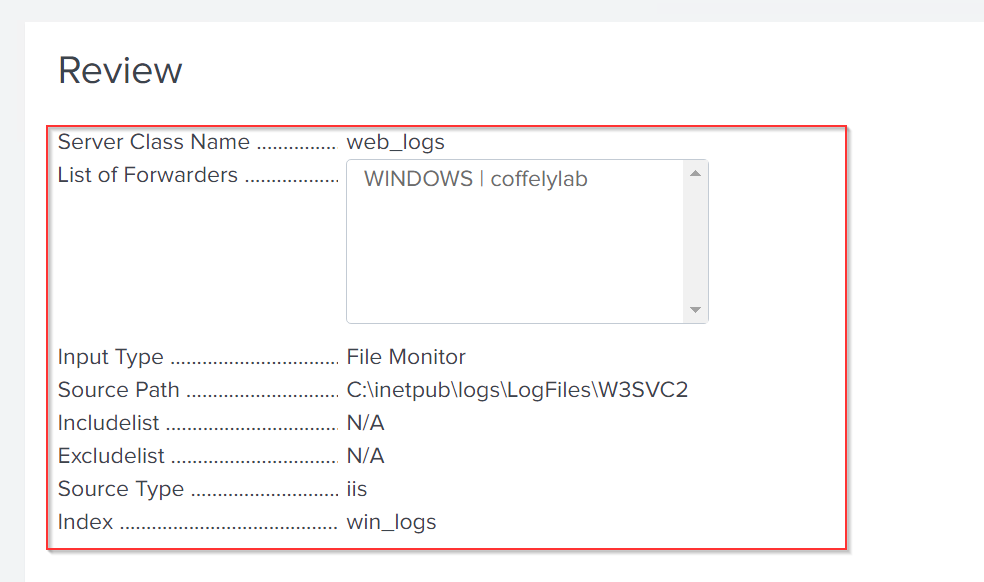
32. Now everything is done. It’s time to see if we get the weblogs in our newly created index. Let’s visit the website coffely.thm and generate some logs. The logs should start propagating in about 4-5 minutes in the search tab, as shown below:
1
index="web_logs" sourcetype="iis"
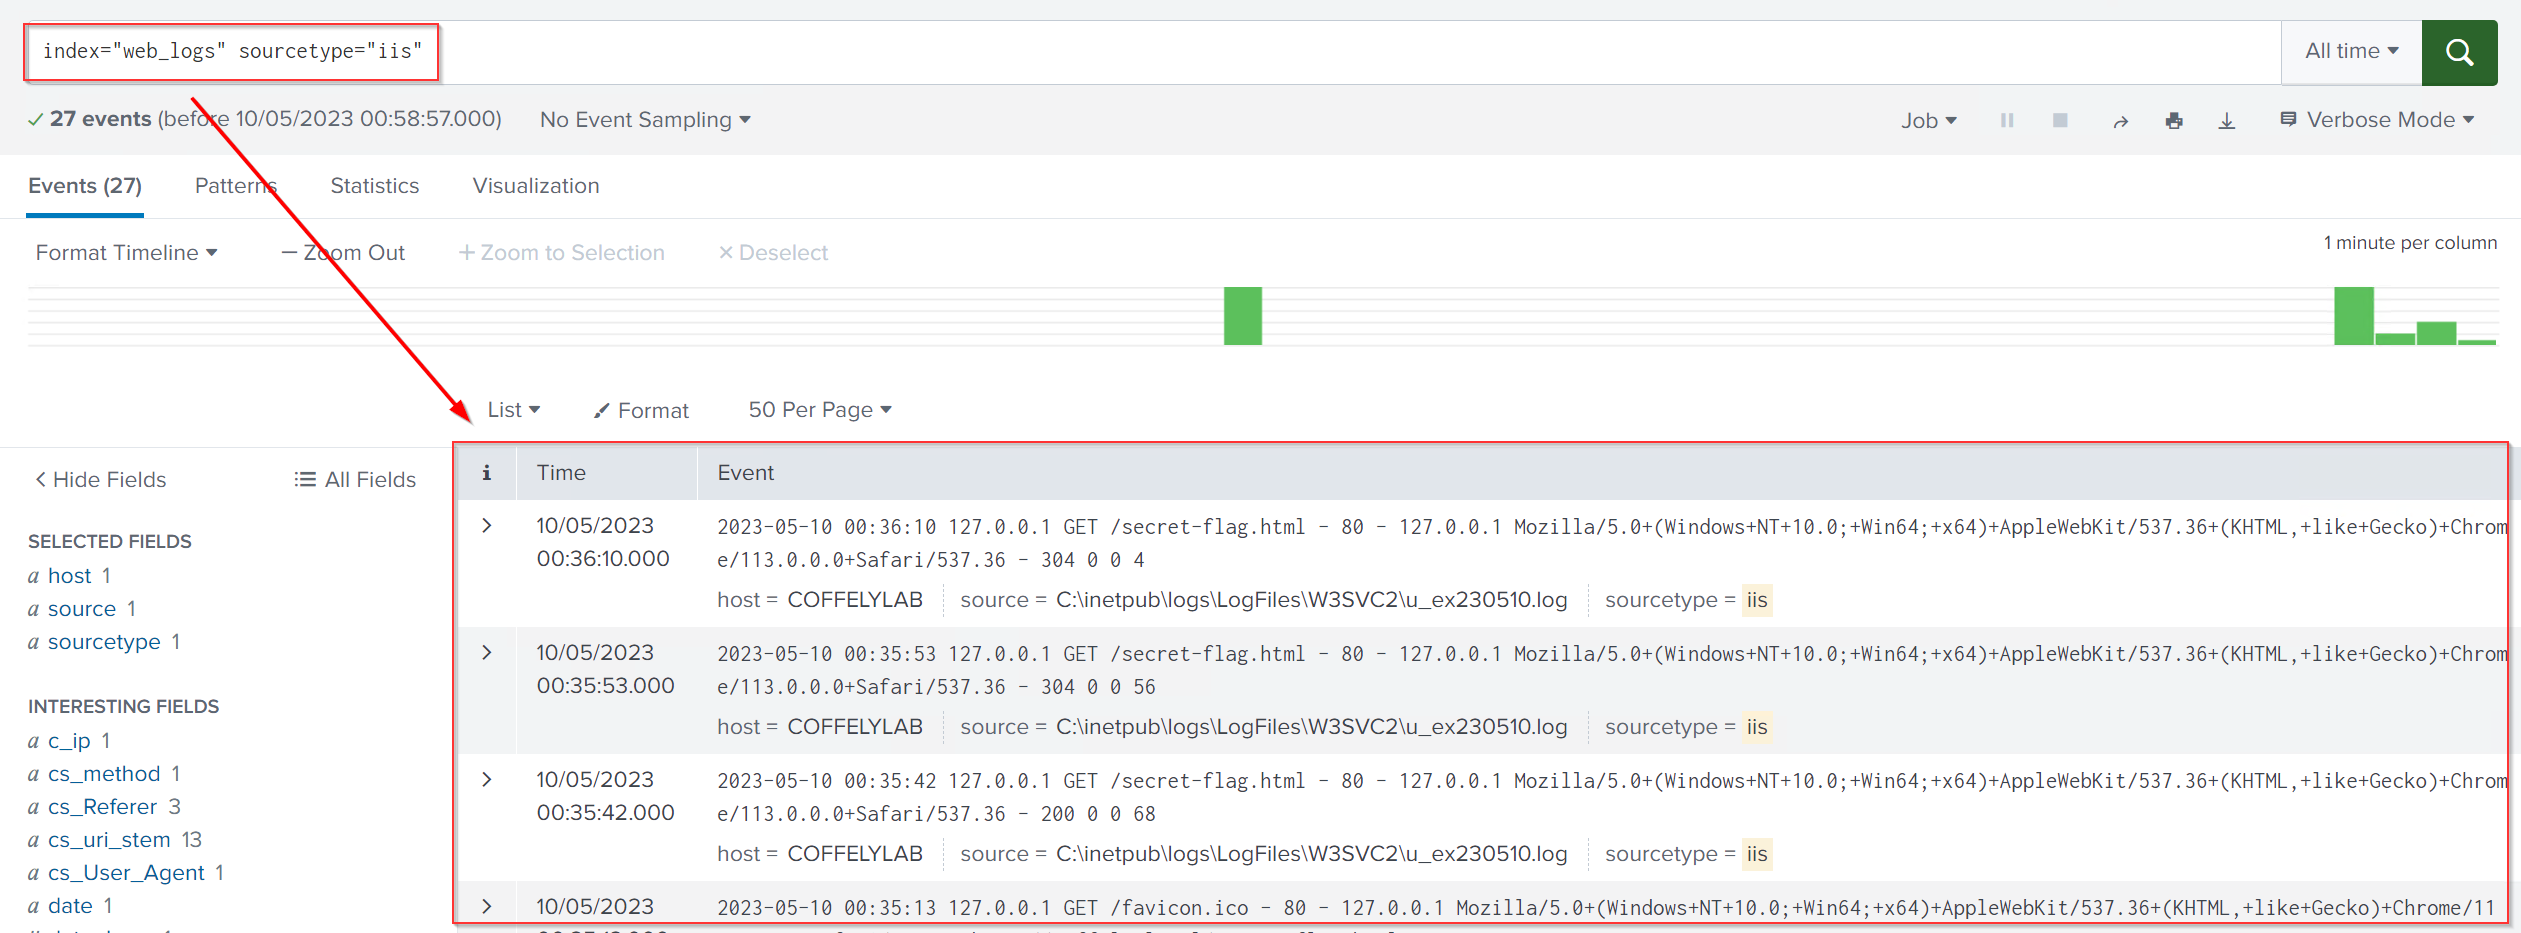
1
Excellent. It looks like we were successful in getting the weblogs ingested into Splunk. However, the logs may need proper parsing and normalizing, which is something to be discussed in upcoming rooms.
Flag: