
Intro
Data processing, parsing, and manipulation in Splunk are crucial for extracting meaningful insights and enabling effective analysis of machine-generated data. From a security perspective, these capabilities are particularly valuable in identifying and responding to security threats, investigating incidents, and monitoring system health.
Learning Objective
Some of the learning objectives that this room will cover are:
1
2
3
4
- How Events are parsed in Splunk
- Importance of configuration files like inputs.conf, transform.conf, and props.conf
- How to Extract custom fields and apply them to filter
- How to identify the timestamp in the Event logs
Scenario:
Let’s play a scenario where You are John, who is working as a SOC Analyst at CyberT. You have been presented with a scenario where one of our clients needs to ingest some logs from a custom source.
Splunk needs to be properly configured to parse and transform the logs appropriately. Some of the issues being highlighted are:
1
2
3
4
5
6
7
8
9
10
11
- **Event Breaking:**
    - Configure Splunk to break the events properly.

- **Multi-line Events:**
    - Configure Splunk to configure multi-line events properly.

- **Masking:**
    - Some logs contain sensitive data. To comply with the PCI DSS (Payment Card Industry Data Security Standard) standard, information like credit card numbers must be masked to avoid any violation.

- **Extracting custom fields:**
    - In the weblogs, some fields are redundant and need to be removed.
Let’s connect to the lab and continue to understand how Splunk data manipulation works at the configuration level.
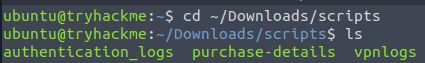
Note: The scripts we will be working on are placed in the ~/Downloads/scripts directory. We will need to run all the commands with a root user.
Scripts on the directory:
Splunk Data Processing : Overview
Splunk is a powerful data analytics platform used for searching, monitoring, and analyzing large amounts of machine-generated data. Data parsing in Splunk involves extracting relevant fields and transforming the data into a structured format for efficient analysis. Here’s a step-by-step guide on how data is parsed in Splunk, including the use of props.conf:
Step 1: Understand the Data Format
First, you need to understand the data format you want to parse. Splunk supports various data formats, such as CSV, JSON, XML, syslog, and more. Determine the format of your data source and the relevant fields you want to extract.
Step 2: Identify the Sourcetype
In Splunk, the sourcetype represents the format of the data being indexed. It helps Splunk apply the appropriate parsing rules. If your data source does not have a pre-defined sourcetype, you can create a custom one in Splunk.
Step 3: Configure props.conf
The props.conf file defines data parsing settings (how logs are being ingested) for specific sourcetypes or data sources. It resides in the $SPLUNK_HOME/etc/system/local directory. Here’s an example of how you can configure props.conf:
1
2
[source::/path/to/your/data]
sourcetype = your_sourcetype
In this example, /path/to/your/data is the path to your data source, and your_sourcetype is the name of the sourcetype you want to assign to that data.
Step 4: Define Field Extractions
You can define regular expressions or use pre-built extraction techniques to parse fields from the data. Here’s an example of defining field extractions in props.conf:
1
2
3
[your_sourcetype]
EXTRACT-fieldname1 = regular_expression1
EXTRACT-fieldname2 = regular_expression2
Replace your_sourcetype with the actual sourcetype name you defined. fieldname1 and fieldname2 represent the names of the fields you want to extract, while regular_expression1 and regular_expression2 are the regular expressions used to match and extract the desired values.
Step 5: Save and Restart Splunk
1
2
3
1. After making changes to `props.conf`,
2. Save the file, and
3. Restart Splunk to apply the new configurations.
You can do this using the Splunk web interface or by using the command line.
Step 6: Verify and Search the Data
Once Splunk restarts, you can search and verify that the data is being parsed correctly. You can use the extracted fields to filter and analyze the data effectively.
In the next task, we will explore important configuration files.
Exploring Splunk Configuration Files
Splunk uses several configuration files to control various data processing and indexing aspects. Let’s explore some of the key configuration files in Splunk, along with examples of their usage:
1. inputs.conf:
- Purpose: Defines data inputs and how to collect data from different sources.
- Example: Suppose you want to monitor a specific log file. You can configure
inputs.confas follows:
1
2
[monitor:///path/to/logfile.log]
sourcetype = my_sourcetype
2. props.conf:
- Purpose: Specifies
parsing rulesfor differentsourcetypesto extract fields and define field extractions. - Example: Suppose you have a custom
sourcetypenamedmy_sourcetypeand want to extract fields using regular expressions. You can define them inprops.conf:
1
2
[my_sourcetype] EXTRACT-field1 = regular_expression1
EXTRACT-field2 = regular_expression2
3. transforms.conf
- Purpose: Allows you to define
field transformationsandenrichmentson indexed events. - Example: Suppose you want to add a new event field based on existing field values. You can use
transforms.conf:
1
[add_new_field] REGEX = existing_field=(.*) FORMAT = new_field::$1
4. indexes.conf
- Purpose: Manages the configuration of indexes in Splunk, including storage, retention policies, and access control.
- Example: Suppose you want to create a new index named
my_indexwith specific settings. You can configureindexes.conf:
1
2
3
4
[my_index] homePath = $SPLUNK_DB/my_index/db
coldPath = $SPLUNK_DB/my_index/colddb
thawedPath = $SPLUNK_DB/my_index/thaweddb
maxTotalDataSizeMB = 100000
5. outputs.conf
- Purpose: Specifies the destination and settings for sending indexed data to various outputs/displays, such as remote Splunk instances or third-party systems.
- Example: Suppose you want to forward your indexed data to a remote Splunk indexer. You can configure
outputs.conf:
1
2
3
[tcpout] defaultGroup = my_indexers
[tcpout:my_indexers]
server = remote_indexer:9997
6. authentication.conf
- Purpose: Manages authentication settings and user authentication methods.
- Example: Suppose you want to enable LDAP authentication for Splunk users. You can configure
authentication.conf:
1
2
3
4
[authentication]
authSettings = LDAP
[authenticationLDAP]
SSLEnabled = true
1
- These are just a few examples of the various configuration files used in Splunk. Each file serves a specific purpose and allows you to customize Splunk’s behavior based on your data sources, parsing requirements, indexing settings, output destinations, and more.
STANZAS in Splunk Configurations
- Stanza defn: A section of a configuration file
Splunk configurations contain various stanza configurations that define how data is processed and indexed. These stanzas have a certain purpose, and it’s important to understand what these are and how they are used. A brief summary of the common stanzas are explained below: 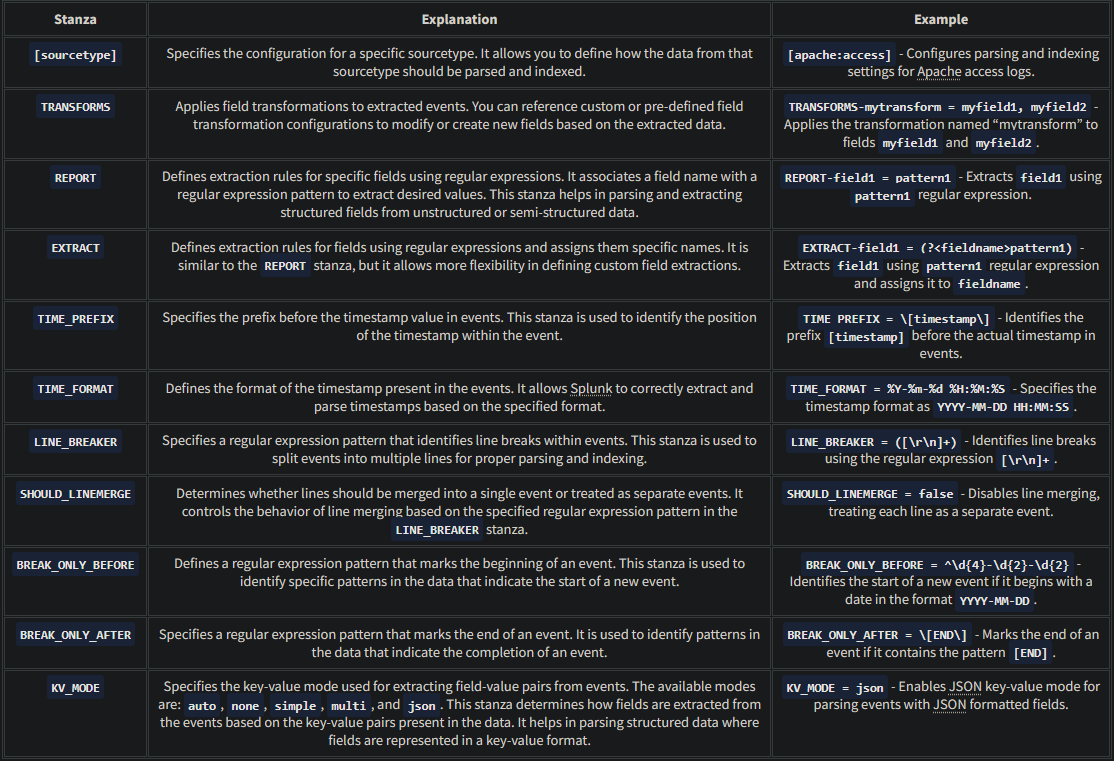
These examples demonstrate the usage of each stanza in props.conf and provide a better understanding of how they can be applied to configure data parsing behavior in Splunk.
In the next task, we will use some of these stanzas explained above to better understand.
Question and Answers section:
- Which stanza is used in the configuration files to break the events after the provided pattern?
1
BREAK_ONLY_AFTER - Which stanza is used to specify the pattern for the line break within events?
1
LINE_BREAKER - Which configuration file is used to define transformations and enrichments on indexed fields?
1
transforms.conf
- Which configuration file is used to define inputs and ways to collect data from different sources?
1
inputs.conf
Creating a Simple Splunk App
We have explored the importance and usage of various configuration files and the purpose-based stanzas within those configuration files. We will be using them extensively in the coming tasks. For now, let’s create a simple Splunk app using the following steps and generate our first sample event using inputs.conf file.
Start Splunk
0. Splunk is installed in the /opt/splunk directory. Go to this directory and run the following command:
1
bin/splunk start
1
 - To start the Splunk instance WITH root privileges.
1. Use the following credentials to log in to the Splunk Interface:
1
2
3
- Username: splunk
- Password: splunk123
Once it is done, open 10.10.174.215:8000 in the browser.
About Splunk Apps
Splunk apps are pre-packaged software modules or extensions that enhance the functionality of the Splunk platform. The purpose of Splunk apps is to provide specific sets of features, visualizations, and configurations tailored to meet the needs of various use cases and industries.
Create a simple App
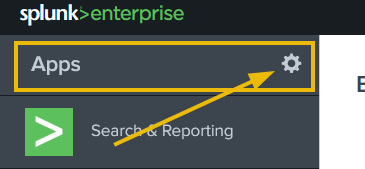
2. Once the Splunk Instance is loaded, click on the Manage App tab as highlighted below:
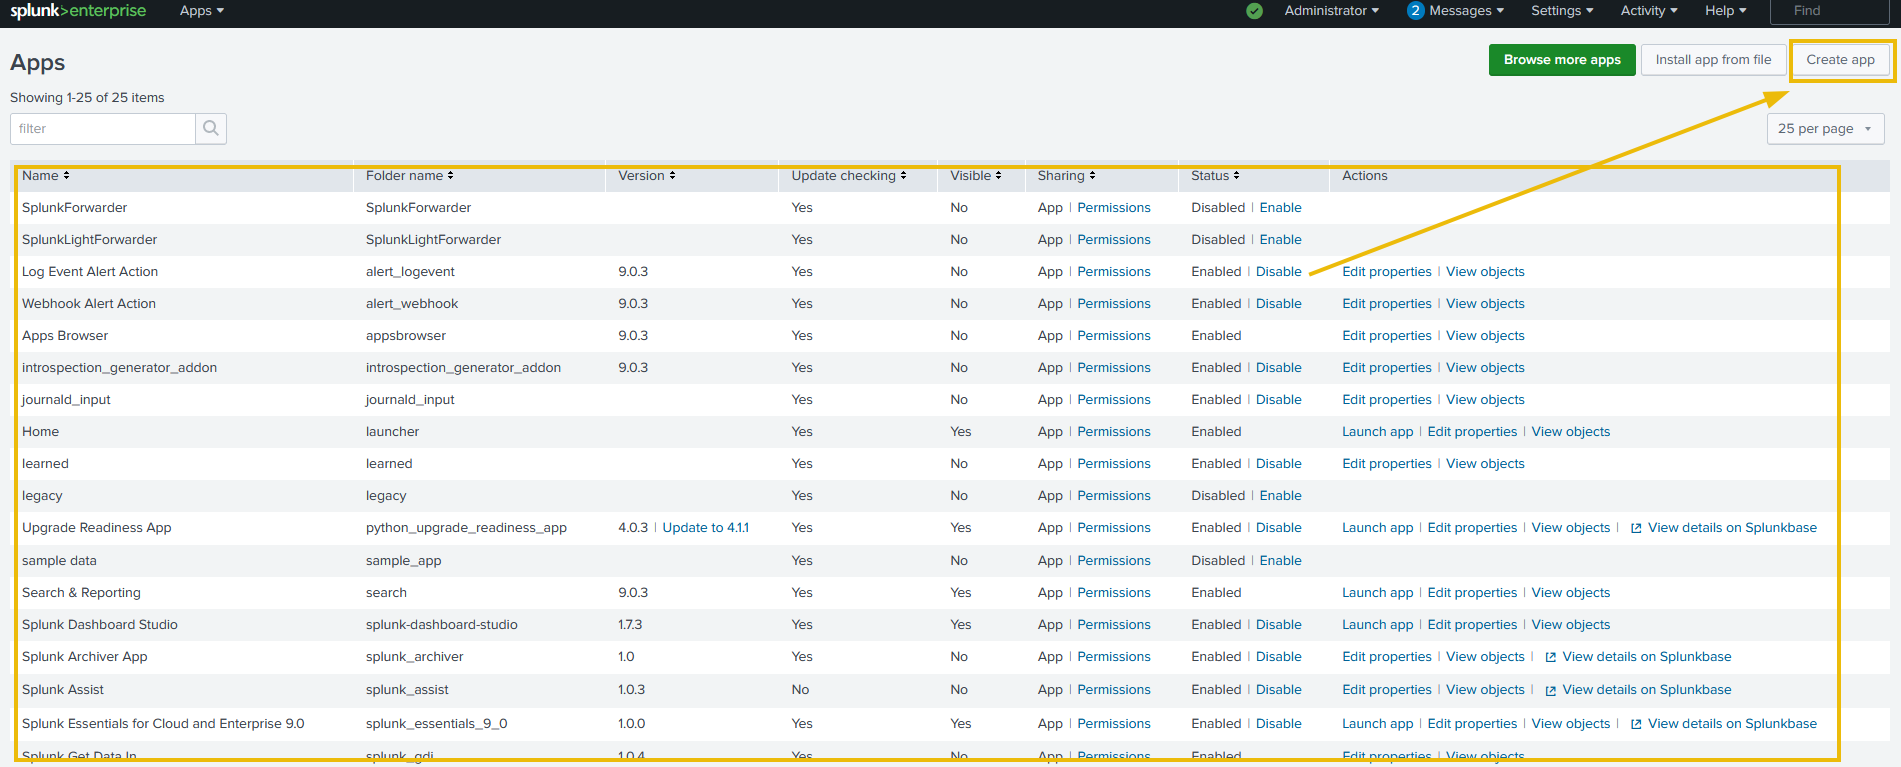
3. It will take us to the page that contains all the available apps in Splunk. To create a new app, Click on the Create App tab as shown below:
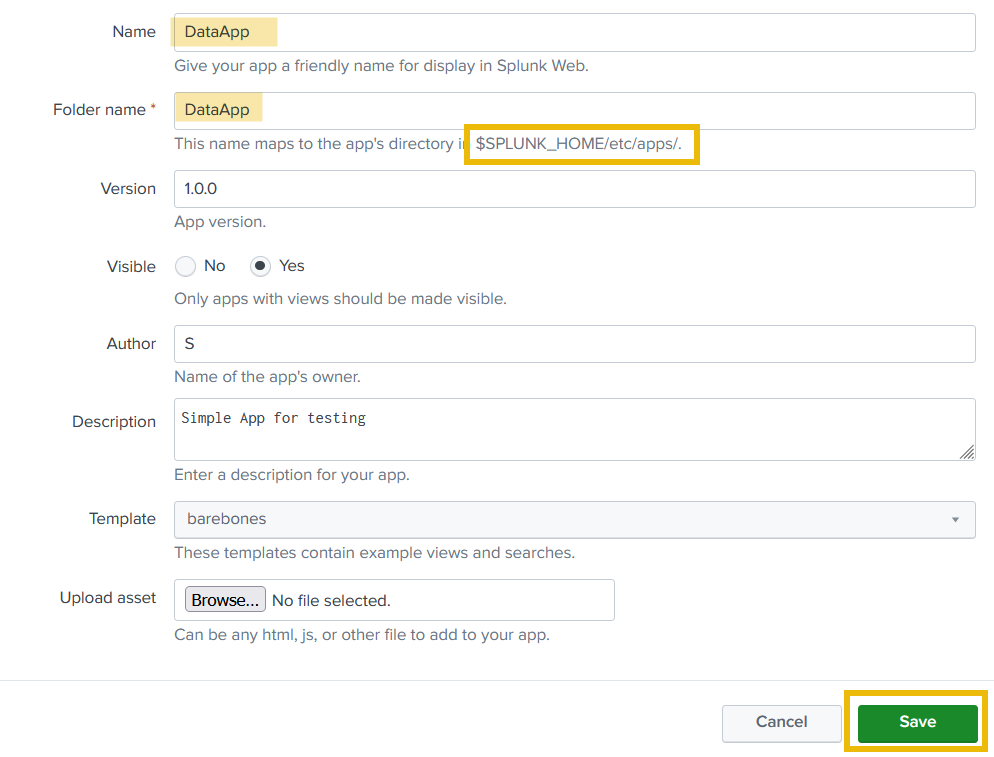
4. Next, fill in the details about the new app that we want to create. The new app will be placed in the /opt/splunk/etc/apps directory as highlighted below:
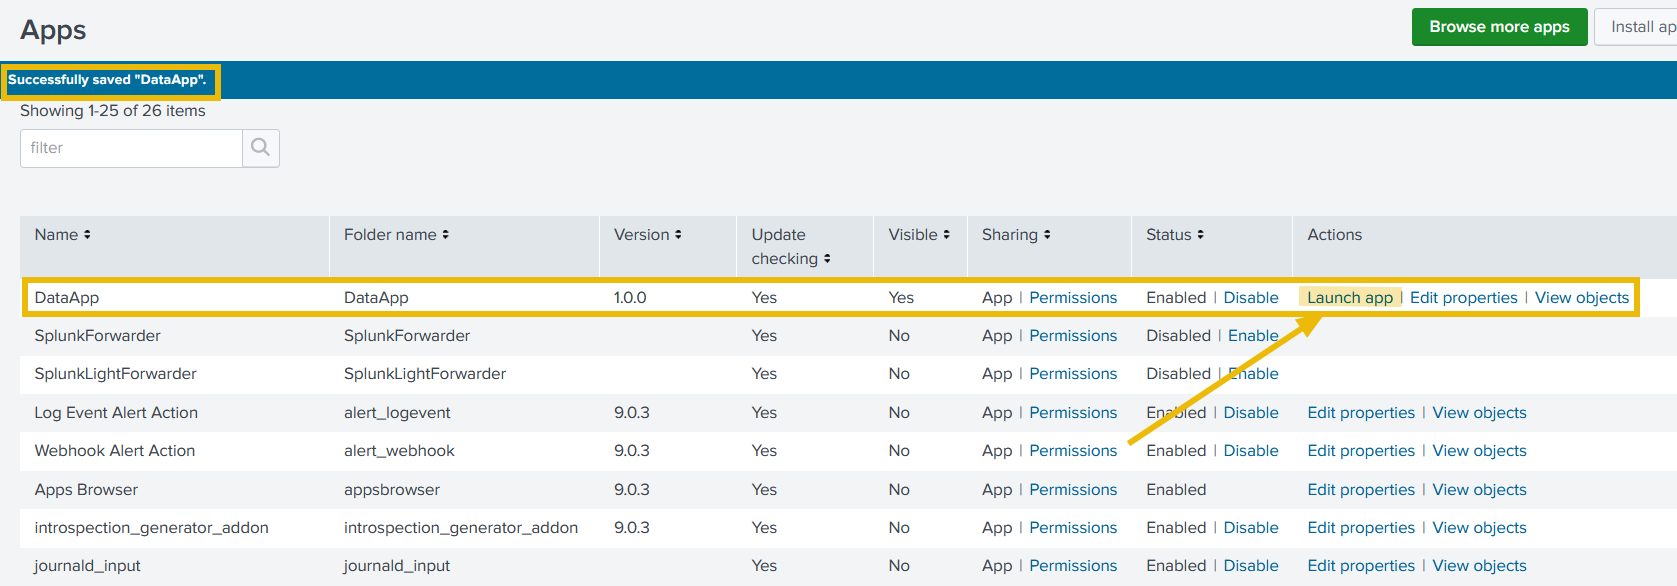
5. Great. A new Splunk app has been created successfully and it can be shown on the Apps page. Click on the Launch App to see if there is any activity logged yet.
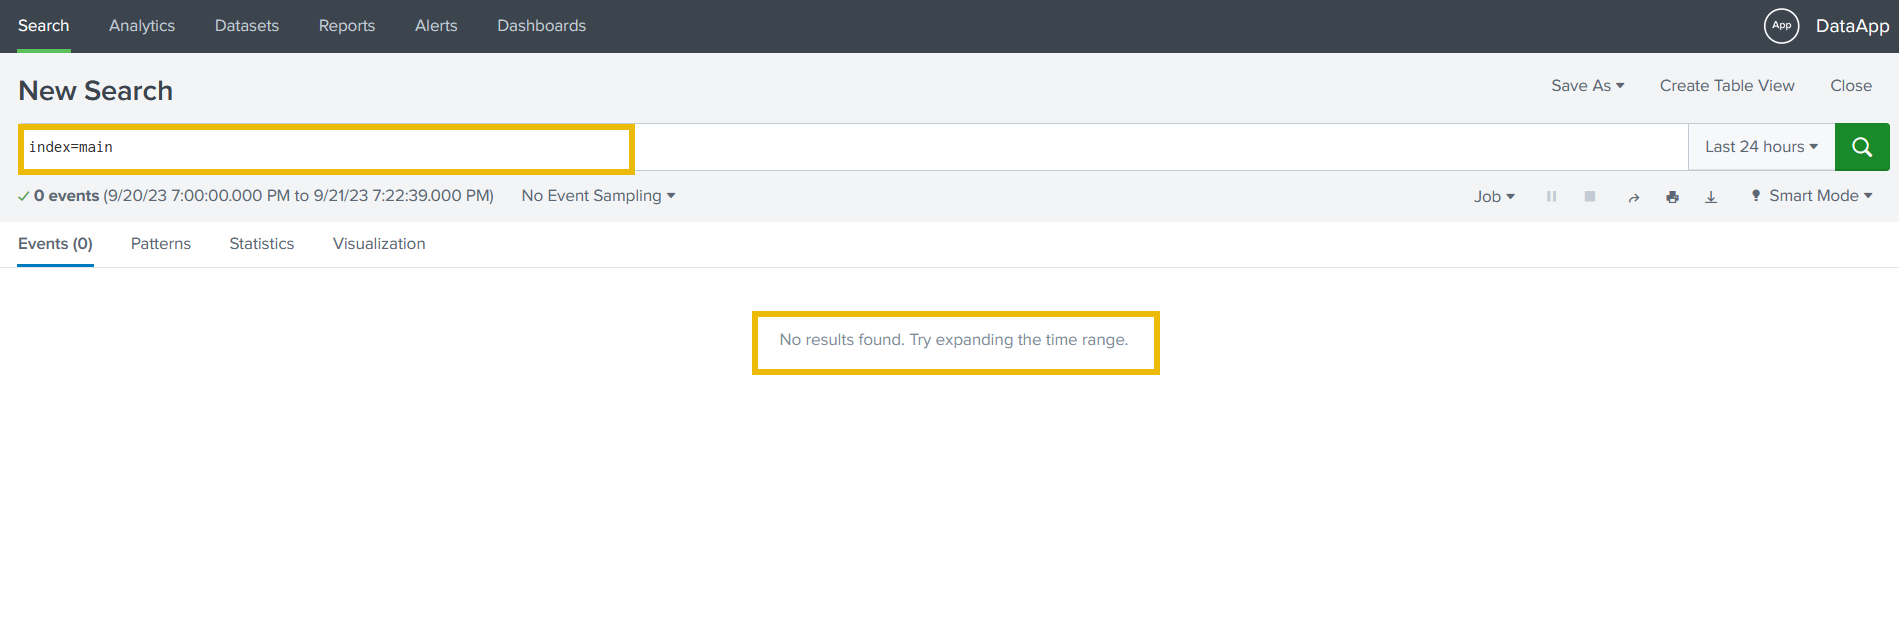
6. As it is evident, no activity has been logged yet. Follow the next steps to generate sample logs.
Understand the App directory
7. Go to the app directory /opt/splunk/etc/apps , where we can locate our newly created app DataApp, as shown below:
1
2
3
4
5
6
7
8
9
10
11
12
13
14
15
root@tryhackme:/opt/splunk/etc/apps# ls
DataApp                       splunk-dashboard-studio
SplunkForwarder               splunk_archiver
SplunkLightForwarder          splunk_assist
alert_logevent                splunk_essentials_9_0
alert_webhook                 splunk_gdi
appsbrowser                   splunk_httpinput
introspection_generator_addon splunk_instrumentation
journald_input                splunk_internal_metrics
launcher                      splunk_metrics_workspace
learned                       splunk_monitoring_console
legacy                        splunk_rapid_diag
python_upgrade_readiness_app  splunk_secure_gateway
sample_app                    user-prefs
search
Content within the App directory
8. Checking the content of the App directory created from the Splunk web application:
1
2
root@tryhackme:/opt/splunk/etc/apps# ls DataApp
bin default local metadata
Splunk App directory
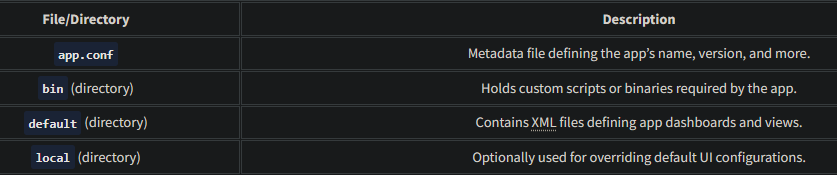
9. Some of the key directories and files that are present in the app directory are explained briefly below:
Create a Python script to generate sample logs
As we learned that the bin directory contains the scripts required by the app, let’s go to the bin directory and create a simple Python script using the command:
1
nano samplelogs.py
10. Copy the following line in the file, and save.
1
print("This is a sample log...")
Let’s use python3 to run the file as shown below and see what output we get:
1
2
root@tryhackme:/opt/splunk/etc/apps/DataApp/bin# python3 samplelogs.py
This is a sample log...
1
- It seems, the script is ready. Note down the full path of the script file, that is `/opt/splunk/etc/apps/DataApp/bin/samplelogs.py`, which we will need later.
Creating Inputs.conf
- In the
defaultdirectory, we will create all necessary configuration files likeinputs.conf,transform.conf, etc.
11. For now, let’s create an inputs.conf using the command:
1
nano inputs.conf
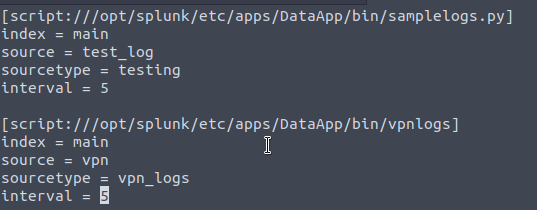
12. Add the following content into the file and save:
1
2
3
4
5
[script:///opt/splunk/etc/apps/DataApp/bin/samplelogs.py]
index = main
source = test_log
sourcetype = testing
interval = 5
The above configuration picks the output from the script samplelogs.py and sends it to Splunk with the index main every 5 seconds.
13. Restart Splunk using the command:
1
/opt/splunk/bin/splunk restart
14. Checking the log from index=main inside the Splunk web app:
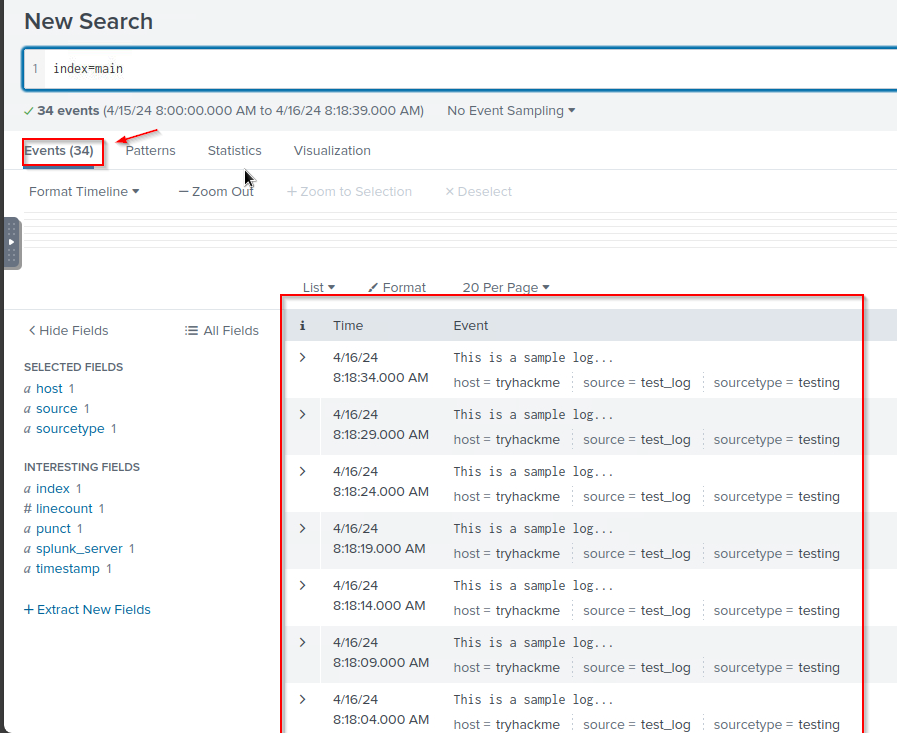
Summary
So far, we have created a simple Splunk app, used the bin directory to create a simple Python script, and then created inputs.conf file to pick the output of the script and throw the output into Splunk in the main index every 5 seconds. In the coming tasks, we will work on the scripts that will generate some events that will have visible parsing issues and then we will work with different configuration files to fix those parsing issues.
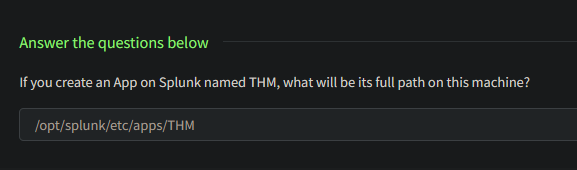
- If you create an App on Splunk named
THM, what will be its full path on this machine?
Event Boundaries - Understanding the problem
Event breaking in Splunk refers to breaking raw data into individual events based on specified boundaries. Splunk uses event-breaking rules to identify where one event ends, and the next begins. Let’s walk through an example using a sample log to understand how event breaking works in Splunk.
Understanding the Events
- In this room, we will be working on the
DataAppcreated in the previous task and is placed at/opt/splunk/etc/apps/DataApp/.
1. For this task, we will use the Python script vpnlogs from the ~/Downloads/scripts directory, as shown below:
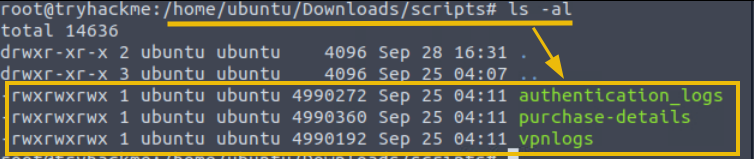
1
- This directory contains various scripts, which we will explore later in this room. For now, let’s focus on the 'vpnlogs' script.
2. Let’s say our client has a custom VPN application that generates VPN logs that contain information about the:
user,VPN server, andaction performed on the connection
as shown in the output below when we run the command ./vpnlogs:
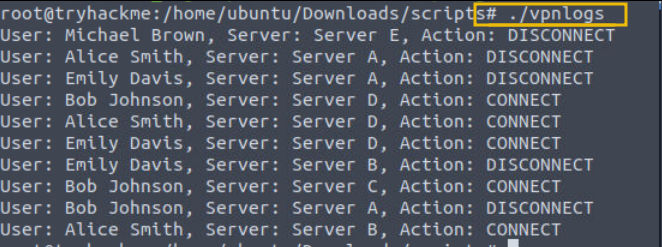
1
- Note that to view these logs, you have to execute them
Generating Events
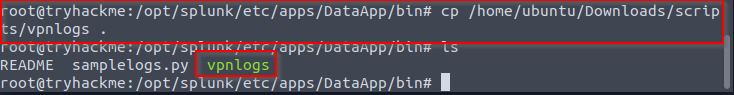
3. Our first task is to configure Splunk to ingest these VPN logs. Copy the vpnlogs script into the bin directory, open the inputs.conf , and write these lines:
1
2
3
4
5
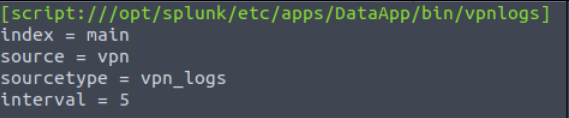
[script:///opt/splunk/etc/apps/DataApp/bin/vpnlogs]
index = main
source = vpn
sourcetype = vpn_logs
interval = 5
After copying the contents to inputs.conf:
After copying the vpnlogs executable:
1
root@tryhackme:/opt/splunk/etc/apps/DataApp/bin# cp /home/ubuntu/Downloads/scripts/vpnlogs .
The above lines tell Splunk to run the script vpnlogs every 5 seconds and send the output to the main index with sourcetype vpn_logs and host value as vpn_server. The inputs.conf file looks like this:
Restart Splunk
4. Save the file and restart Splunk using the command /opt/splunk/bin/splunk restart. Open the Splunk instance at 10.10.174.215:8000 and navigate to the search head.
1
/opt/splunk/bin/splunk restart
Search Head
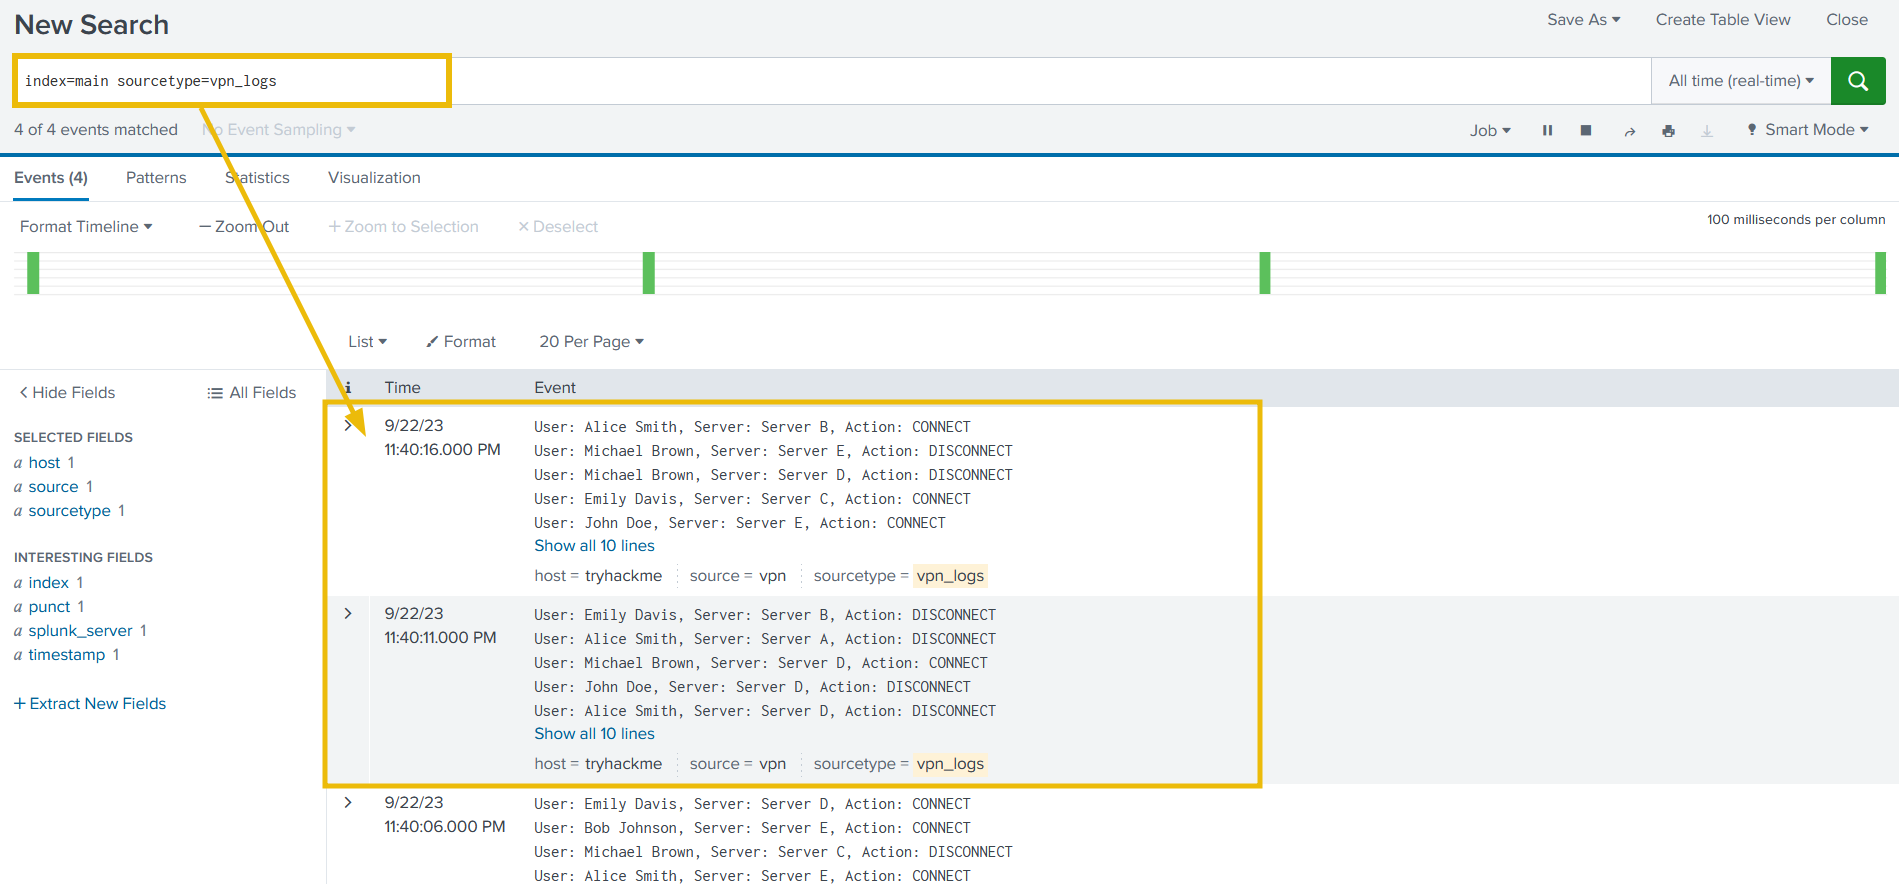
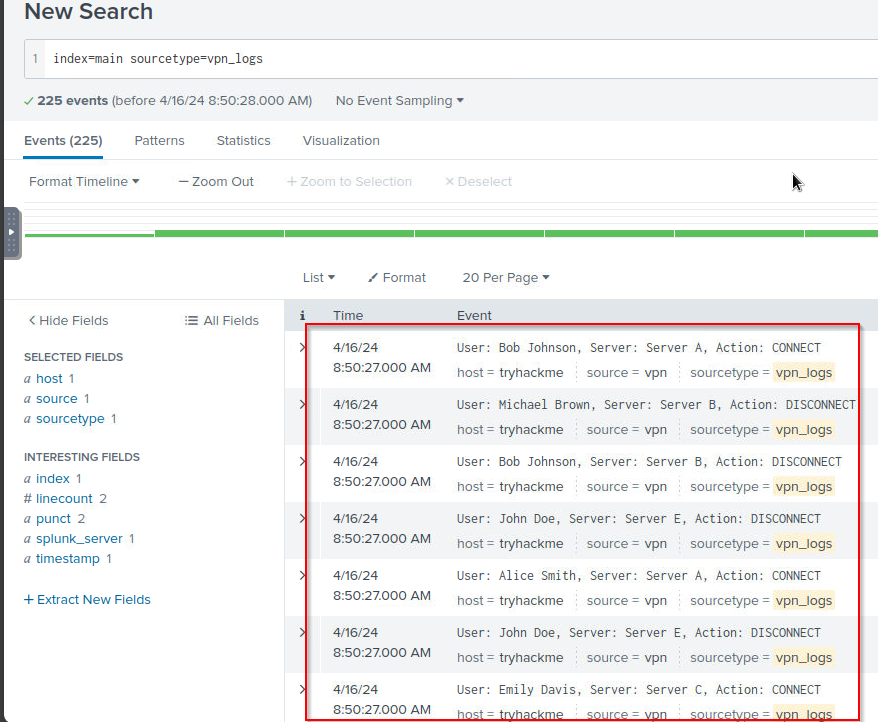
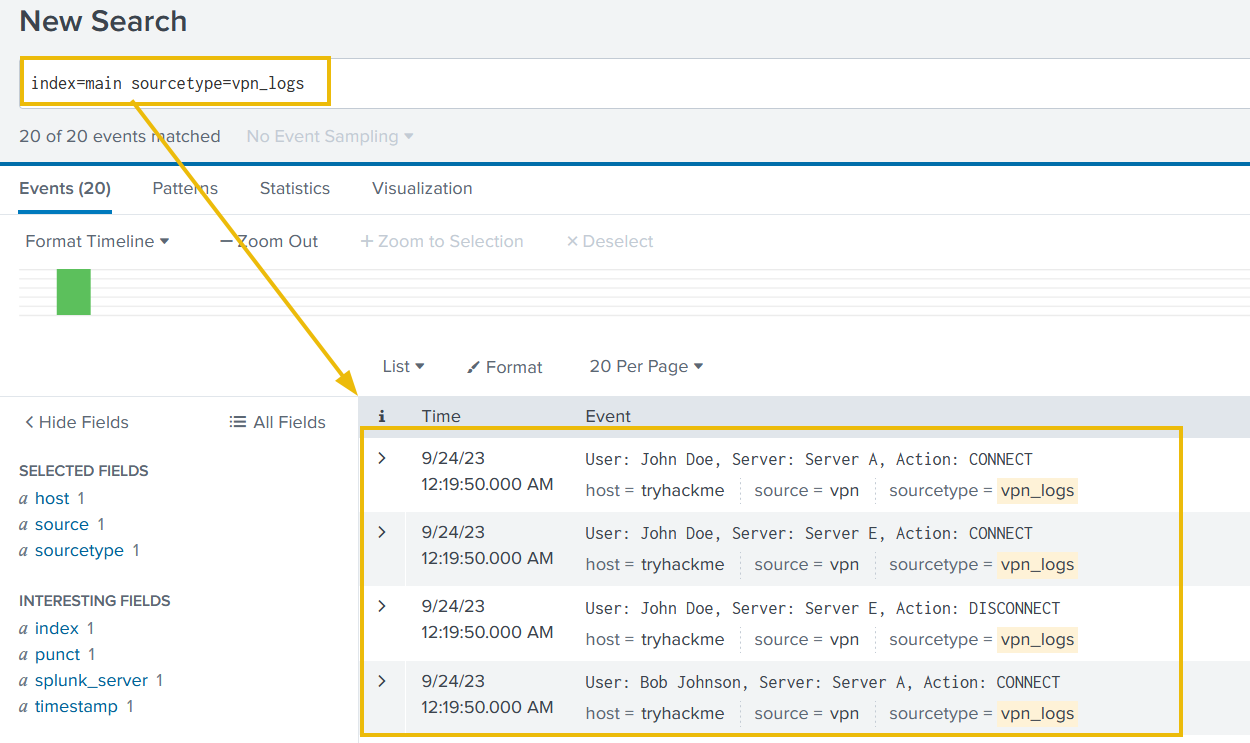
5. Select the time range All time (Real-time) and use the following search query to see if we are getting the logs.
Search Query:
1
index=main sourcetype=vpn_logs
1
- You can see the interval on the bar graph just above the logs
Identifying the problem
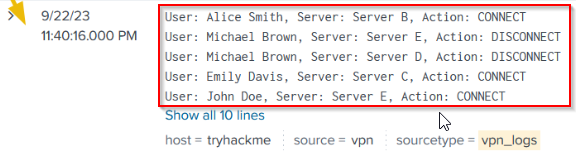
6. Excellent, we are getting the VPN logs after every 5 seconds. But can you observe the problem? It’s evident that Splunk cannot determine the boundaries of each event and considers multiple events as a single event. By default, Splunk breaks the event after carriage return instead of breaking it at newline.
Mistake: -> 5 events clustered as a single event:
Fixing the Event Boundary
7. We need to fix the event boundary. To configure Splunk to break the events in this case, we have to make some changes to the props.conf file. First, we will create a regex to determine the end of the event. The sample events are shown below…
Sample Events:
1
2
3
4
5
6
7
8
9
10
User: Emily Davis, Server: Server C, Action: DISCONNECT
User: John Doe, Server: Server B, Action: DISCONNECT
User: Bob Johnson, Server: Server B, Action: DISCONNECT
User: Emily Davis, Server: Server D, Action: CONNECT
User: Alice Smith, Server: Server D, Action: CONNECT
User: Alice Smith, Server: Server A, Action: DISCONNECT
User: Bob Johnson, Server: Server C, Action: DISCONNECT
User: John Doe, Server: Server D, Action: DISCONNECT
User: John Doe, Server: Server B, Action: DISCONNECT
User: Michael Brown, Server: Server E, Action: CONNECT
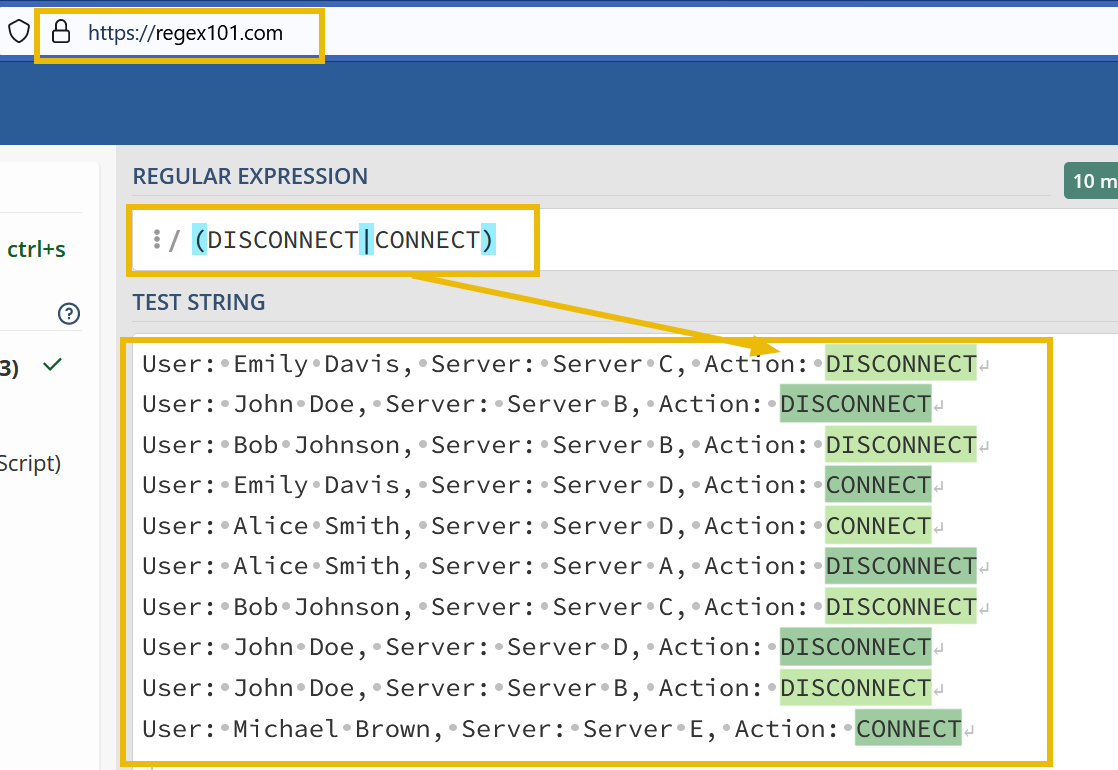
- We will use
[reg101.com](https://tryhackme.com/r/room/reg101.com)to create a regex pattern. If we look closely, all events end with the termsDISCONNECTorCONNECT. We can use this information to create a regex pattern(DISCONNECT|CONNECT), as shown below:
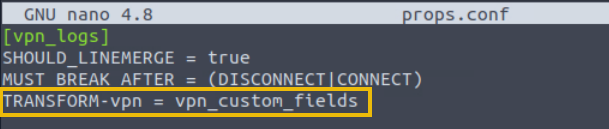
8. Now, let’s create a props.conf in the default directory within the DataApp and add the following lines:
1
2
3
[vpn_logs]
SHOULD_LINEMERGE = true
MUST_BREAK_AFTER = (DISCONNECT|CONNECT)
1
2
- This configuration tells Splunk to take the sourcetype to merge all lines and it **must break** the events when you see the pattern matched in the mentioned regex.
- The last string on the line acts as a delimiter instead
Restart Splunk
9. Save the file and restart Splunk using the command /opt/splunk/bin/splunk restart. Open the Splunk instance at 10.10.174.215:8000 and navigate to the search head.
1
index=main sourcetype=vpn_logs
Output:
1
- Works well now!
That’s it. We can see that with a few changes in the props.conf file, we changed how Splunk broke these VPN logs generated by the custom vpn_server.
In the next task, we will look at a different case study.
Question and Answers section:
- Which configuration file is used to specify parsing rules?
1
props.conf
- What regex is used in the above case to break the Events?
1
DISCONNECT|CONNECT
- Which stanza is used in the configuration to force Splunk to break the event
afterthe specified pattern? (not sure if this is a stanza or not)1
MUST_BREAK_AFTER - If we want to disable line merging, what will be the value of the stanza
SHOULD_LINEMERGE?1
false
Parsing Multi-Line Events
As we know, different log sources have their own ways of generating logs. What if, a log source generates event logs that comprise of multi-lines? One such example is Windows Event logs. In order to understand how multi-line events can be handled in Splunk, we will use the event logs generated from the script authentication_logs. The sample event log is shown below:
1
2
[Authentication]:A login attempt was observed from the user Michael Brown and machine MAC_01
at: Mon Jul 17 08:10:12 2023 which belongs to the Custom department. The login attempt looks suspicious.
As it is clearly shown, the event contains multiple lines. Let’s update the inputs.conf file to include this script and see if Splunk is able to break the event as intended.
Copy the authentication_logs script from the ~/Downloads/scripts directory into the bin folder of the DataApp and add the following lines in inputs.conf, save the file, and restart Splunk:
1
2
3
4
5
[script:///opt/splunk/etc/apps/DataApp/bin/authentication_logs]
interval = 5
index = main
sourcetype= auth_logs
host = auth_server
Search Head
Let’s look at the Splunk Search head to see how these logs are reflected.
Search Query:
1
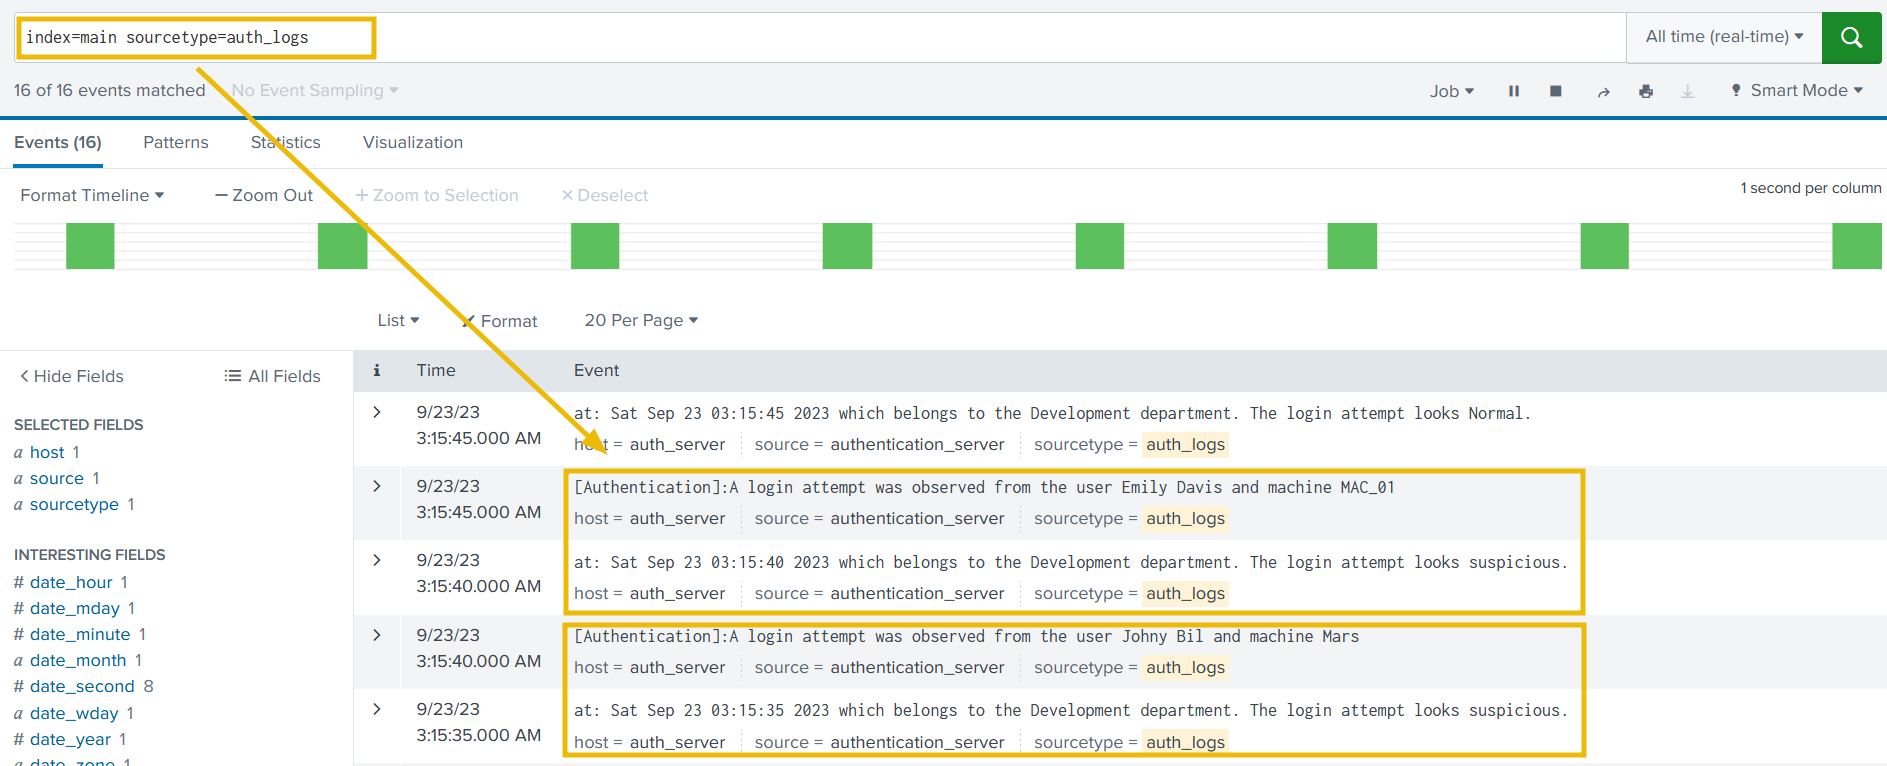
index=main sourcetype = auth_logs

Identifying the problem
If we observe the events, we will see that Splunk is breaking the 2-line Event into 2 different events and is unable to determine the boundaries.
Fixing the Event Boundary
In order to fix this issue, we can use different stanzas in the props.conf file. If we run the script a few times to observe the output, we can see that each event starts with the term [Authentication], indicating the start of the event. We can use this as the regex pattern with the stanza BREAK_ONLY_BEFORE and see if it could fix this problem. Copy the following lines in props.conf file, save the file, and then restart Splunk to apply changes.
1
2
3
[auth_logs]
SHOULD_LINEMERGE = true
BREAK_ONLY_BEFORE = \[Authentication\]
Search head
Go to Splunk Search head, and use the following search query.
Search Query:
1
index=main sourcetype = auth_logs
- Which stanza is used to break the event boundary before a pattern is specified in the above case?
1
BREAK_ONLY_BEFORE - Which regex pattern is used to identify the event boundaries in the above case?
1
\[Authentication\]
Masking Sensitive Data
Masking sensitive fields, such as credit card numbers, is essential for maintaining compliance with standards like PCI DSS (Payment Card Industry Data Security Standard) and HIPAA (Health Insurance Portability and Accountability Act). Splunk provides features like field masking and anonymization to protect sensitive data.
1
2
- Field Masking
- Anonymization
Here’s an example of credit card numbers being populated in the Event logs generated by the script purchase-details present in the ~/Downloads/scripts directory.
Sample Output
1
2
3
4
5
User William made a purchase with credit card 3714-4963-5398-4313.
User John Boy made a purchase with credit card 3530-1113-3330-0000.
User Alice Johnson made a purchase with credit card 6011-1234-5678-9012.
User David made a purchase with credit card 3530-1113-3330-0000.
User Bob Williams made a purchase with credit card 9876-5432-1098-7654.
1. Copy this script file into the bin folder of the DataApp and configure the inputs.conf file to ingest these logs into Splunk. To do so, add the following lines in the inputs.conf file:
1
2
3
4
5
6
[script:///opt/splunk/etc/apps/DataApp/bin/purchase-details]
interval = 5
index = main
source = purchase_logs
sourcetype= purchase_logs
host = order_server
- This configuration tells Splunk to get the output from the
purchase-detailsscript, and index into themainindex every 5 seconds, with sourcetypepurchase_logsand host asorder_server.
2. Now, save the file and restart Splunk. Log on to Splunk and apply the following search query:
Search Query:
1
index=main sourcetype=purchase_logs
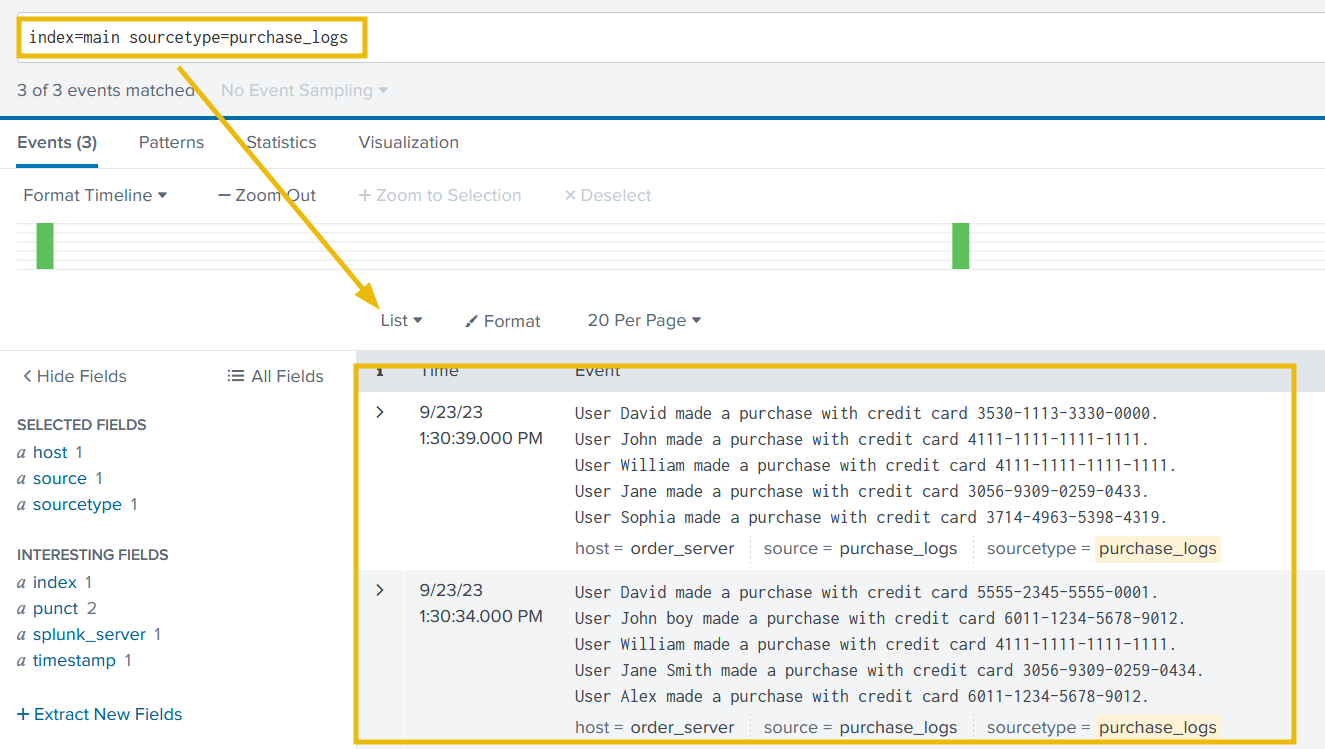
It looks like we have two problems to address:
1
2
- We need to hide the credit card information that is being added to each event AND
- Also need to fix the event boundaries
Fixing Event Boundaries
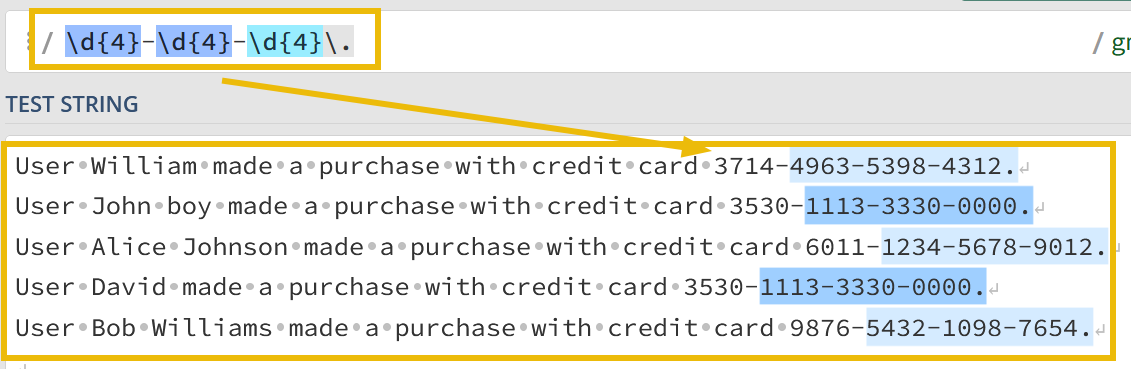
We will use regex101.com to create a regex pattern to identify the end boundary of each event, as shown below:
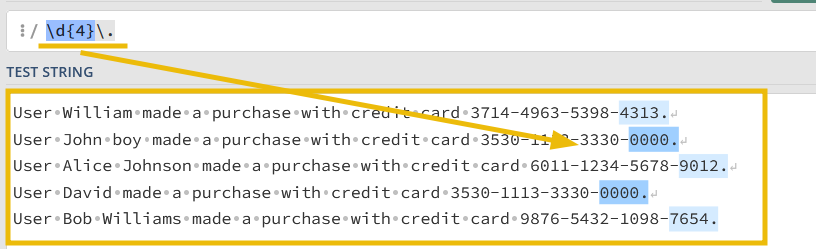
3. Let’s update the props.conf, as shown below:
1
2
3
[purchase_logs]
SHOULD_LINEMERGE = true
MUST_BREAK_AFTER = \d{4}\.
4. Save the file, and restart Splunk. If everything goes well, the event should be propagating correctly, as shown below: Search Query:
1
index=main sourcetype=purchase_logs
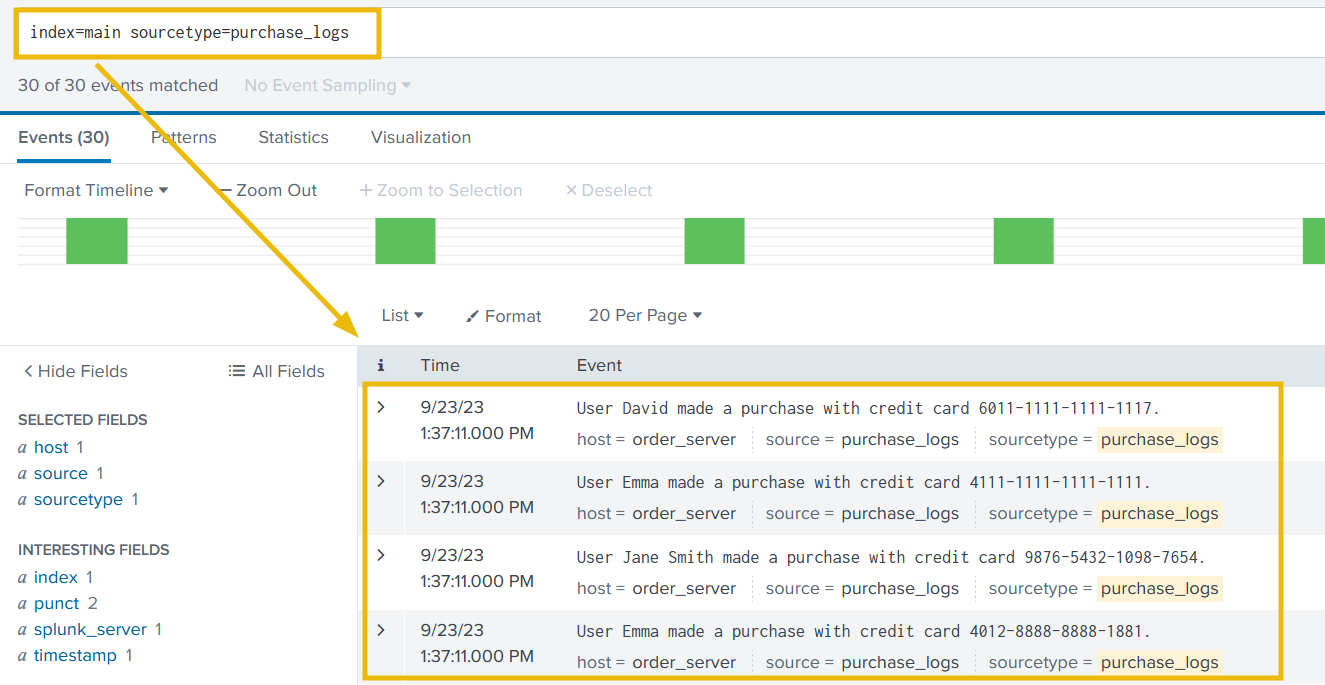
Now that we have fixed the event boundary issue. It’s time to mask the sensitive information from the events.
Introducing SEDCMD
5. In Splunk, the sedcmd configuration setting is used in the props.conf file to modify or transform data during indexing. It allows us to apply regular expression-based substitutions on the incoming data before indexing it. The sedcmd setting uses the syntax and functionality of the Unix sed command.
1
- Remember that 'sed' Linux utility is used to replacement a string/substring
Here’s a brief explanation of how the sedcmd works in props.conf:
1
2
3
4
1. Open the 'props.conf' file in your Splunk configuration directory.
2. Locate or create a stanza for the data source you want to modify.
3. Add the 'sedcmd' setting under the stanza.
4. Specify the regular expression pattern and the replacement string using the 's/' syntax similar to the 'sed' command.
Here’s an example of using sedcmd in props.conf to modify a field called myField:
1
2
[source::/path/to/your/data]
SEDCMD-myField = s/oldValue/newValue/g
1
- Look at the format for the 'myField' above in the props.conf configuration file.
In this example, the sedcmd setting is applied to the data from a specific source path. It uses the regular expression pattern oldValue and replaces it globally with newValue using the g flag in the myField field.
1
- This transformation occurs BEFORE Splunk indexes the data.
It is important to note that, this sedcmd is just one of the configuration settings props.conf used for data transformation. There are other options available, such as REGEX, TRANSFORMS, etc.
Masking CC Information
6. Let’s now use the above knowledge gain to create a regex that replaces the credit card number with something like this -> 6011-XXXX-XXXX-XXXX., as shown below:
Now, our task is to use this
s/OLD_VALUE>/<NEW_VALUE>/gregex insedcmdto replace the credit card numbers withXXXX-XXXX-XXXX.The final
sedcmdvalue will becomes/-\d{4}-\d{4}-\d{4}/-XXXX-XXXX-XXXX/g.
Our configuration in the props.conf would look like this:
1
2
3
4
[purchase_logs]
SHOULD_LINEMERGE = true
MUST_BREAK_AFTER = \d{4}\.
SEDCMD-cc = s/-\d{4}-\d{4}-\d{4}/-XXXX-XXXX-XXXX/g
1
- Replaces the last 3 sets of four digits with "XXXX"
7. Restart Splunk and check Splunk Instance to see how our changes are reflected in the logs.
1
- Great. With some changes in the configurations, we were able to mask the sensitive information. As a SOC analyst, it is important to understand the criticality of masking sensitive information before being logged in order to comply with standards like HIPAA, PCI-DSS, etc.
- Which stanza is used to break the event after the specified regex pattern?
1
MUST_BREAK_AFTER - What is the pattern of using
SEDCMDin theprops.confto mask or replace the sensitive fields?1
s/oldValue/newValue/g
Extracting Custom Fields from logs
From a SOC analyst’s point of view, we would often encounter logs either custom log sources, where not all fields are extracted by the SIEM automatically, or we are required to extract custom fields to improve the analysis. In that case, we need a way to extract custom fields from the logs. To demonstrate this with an example, let’s go back to our vpn_logs case. The output we are getting in Splunk is, as shown below:
1
index=main sourcetype=vpn_logs
1
- It's clear that none of the fields are extracted automatically, and we can not perform any analysis on these events until fields like 'username', 'server', and 'action' are extracted.
Extracting Username
0. Let’s first go through the process of extracting the usernames and putting them under the field as Username, and then we can follow the same steps to extract other fields as well.
Creating Regex Pattern
1. Our first task would be to create a regex pattern to capture the username values we are trying to capture. Sample event logs look like this:
1
2
3
4
5
6
7
8
9
10
User: John Doe, Server: Server C, Action: CONNECT
User: John Doe, Server: Server A, Action: DISCONNECT
User: Emily Davis, Server: Server E, Action: CONNECT
User: Emily Davis, Server: Server D, Action: DISCONNECT
User: Michael Brown, Server: Server A, Action: CONNECT
User: Alice Smith, Server: Server C, Action: CONNECT
User: Emily Davis, Server: Server C, Action: DISCONNECT
User: John Doe, Server: Server C, Action: CONNECT
User: Michael Brown, Server: Server A, Action: DISCONNECT
User: John Doe, Server: Server D, Action: DISCONNECT
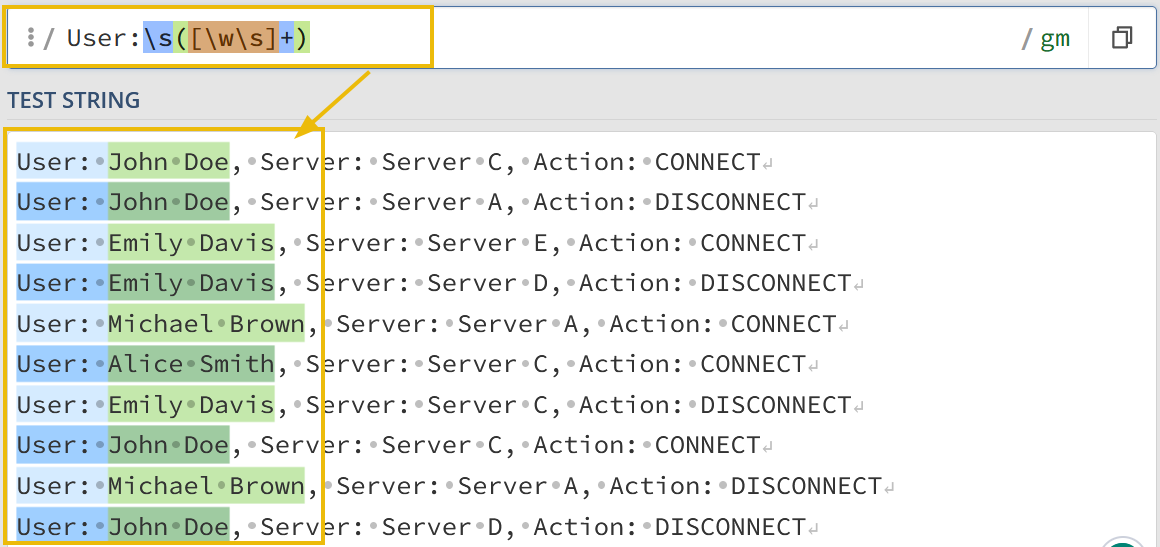
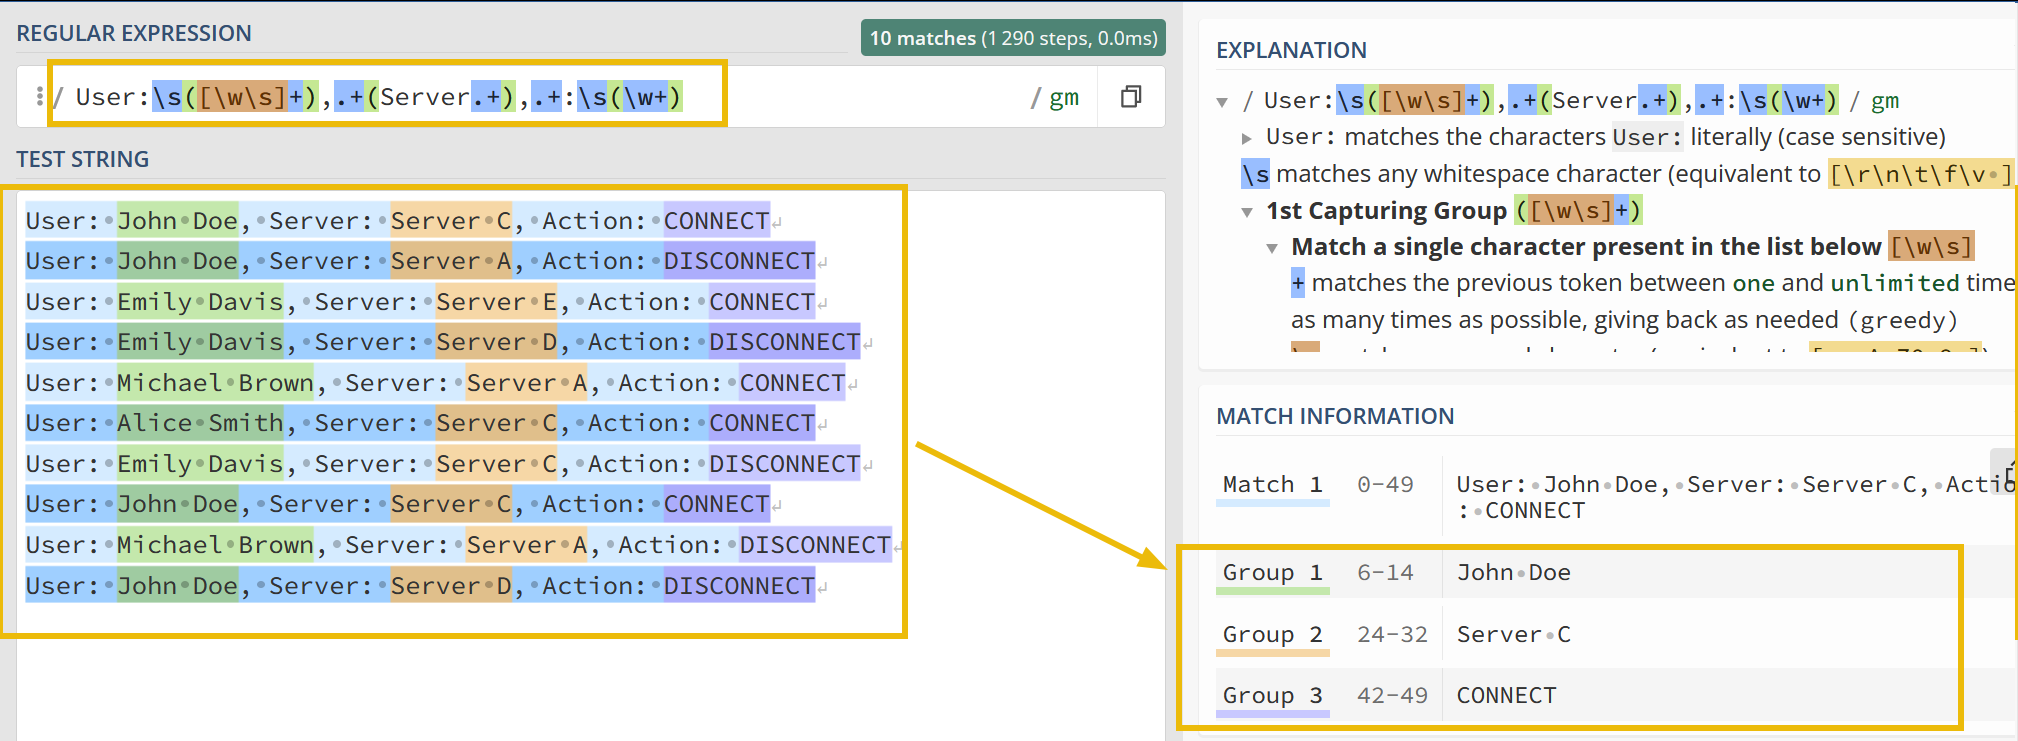
2. By creating a regex pattern as: User:\s([\w\s]+) and creating a capturing group, we have successfully captured all the usernames that we want to extract.
1
User:\s([\w\s]+)
Creating and Updating transforms.conf
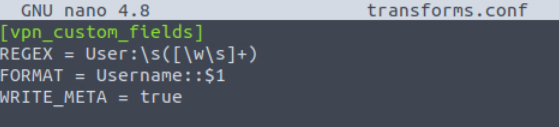
Now, let’s create a transforms.conf in the default folder of the DataApp directory, and put the following configurations in it as it is.
1
2
3
4
[vpn_custom_fields]
REGEX = User:\s([\w\s]+)
FORMAT = Username::$1
WRITE_META = true
- The
transforms.confwould look like this:
Explanation:
1
2
3
4
- We have created a custom identifier `'vpn_custom_fields'`,
- Used the 'regex' pattern to pull the usernames from the logs,
- Mentioned the field name as 'Username', and
- Asked to capture the first group by referring to it as '$1'.
1
- Save the configuration and move to the next step.
Updating props.conf
We need to update the props.conf to mention the recent updates we did in transforms.conf. Here, we are appending the configuration for sourcetype vpn_logs with the line TRANSFORM-vpn = vpn_custom_fields, as shown below:
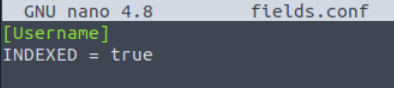
Creating and Updating fields.conf
The next step would be to create fields.conf and mention the field we are going to extract from the logs, which is Username. INDEXED = true means we are telling Splunk to extract this field at the indexed time.
1
2
[Username]
INDEXED = true
Fields.conf file would look like this:
Restart Splunk
That’s all we need in order to extract the custom fields. Now, restart the Splunk instance so that the changes we have made are committed. Go to the Splunk instance and use the search query:
1
index=main sourcetype=vpn_logs
1
2
3
- There is a field that capture the usernames from the logs displayed in Splunk web application!
- This is it. With some changes to the configuration files, we were able to extract a custom field from the logs.
- Let's use the same process and extract the remaining two fields as well.
Creating Regex Pattern
This regex pattern User:\s([\w\s]+),.+(Server.+),.+:\s(\w+) captures all the three fields and places them into the groups, as shown below:
1
User:\s([\w\s]+),.+(Server.+),.+:\s(\w+)
Updating transforms.conf
- Now that we have captured the fields that we want to extract, let’s update the
transforms.conffile, as shown below:1 2 3 4
[vpn_custom_fields] REGEX = User:\s([\w\s]+),.+(Server.+),.+:\s(\w+) FORMAT = Username::$1 Server::$2 Action::$3 WRITE_META = true
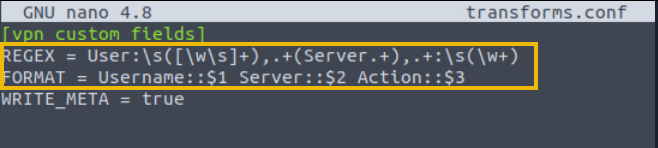
In the configuration file, we have updated the REGEX pattern and the FORMAT, where we have specified different fields separating with a space.
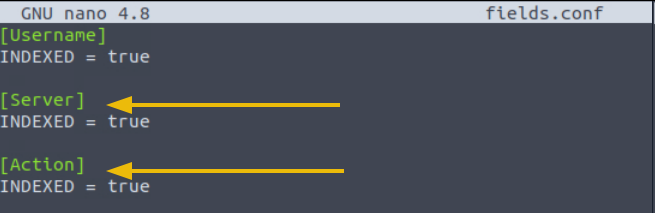
Updating fields.conf
Now it’s time to update the fields.conf with the field names that we want Splunk to extract at index time:
Restart Splunk
As we have updated the configuration, we will need to restart Splunk for the changes to work. After restarting, go to the Splunk instance and use the search query index=main sourcetype=vpn_logs to check the impact of the changes we made earlier.
1
index=main sourcetype=vpn_logs
- Extract the Username field from the sourcetype purchase_logs we worked on earlier. How many Users were returned in the Username field after extraction?
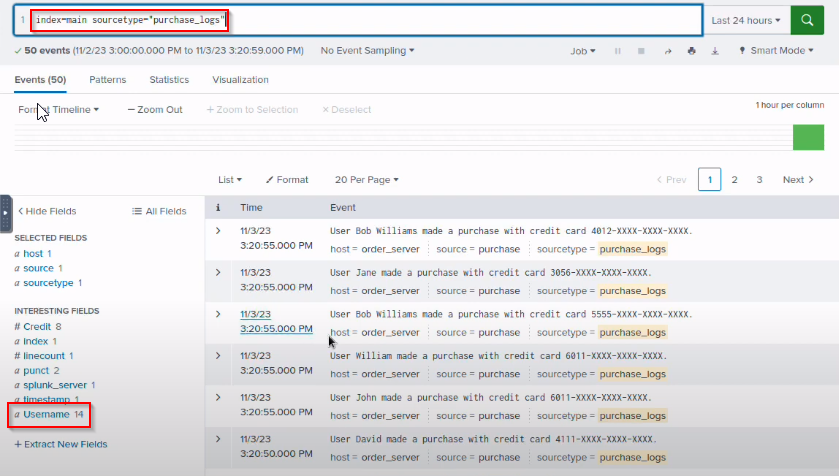
1
14
- Extract
Credit-Cardvalues from the sourcetypepurchase_logs, how many unique credit card numbers are returned against the Credit-Card field?1
16- Kinda lost on this question. How many times is the “purchase_logs” file going to be executed?
Conclusion
This room covered how to configure Splunk to parse and manipulate data according to the situation or requirement. As a SOC Analyst, it’s important to know how to change different configuration files to make Splunk work as intended. In this room, we learned the following:
1
2
3
4
- How to define Event boundaries in Splunk.
- How to mask Sensitive information.
- How to make configuration changes in inputs.conf, props.conf, and transforms.conf
- How to extract custom Events in Splunk.